Accurately forecast sales volumes despite market volatility
Integrate the impact of exogenous and endogenous factors
Optimize inventory and procurement in line with reality
Adapt strategies starting with the finest level: product and store
Simulate the impacts of business decisions before implementing them
Ensuring the reliability, traceability, and governance of forecasts

Forecast of the request AI-assisted
BOOPER MPS models purchasing behavior using machine learning and deep learning algorithms capable of predicting:
- Sales by product, category, point of sale, and period
- The effects of seasonality and business cycles
- The impact of promotions and price variations
- All this, taking into account competition, trend reversals, and weak signals.
The models are continuously retrained to improve their accuracy over time.
Result: a reliable and dynamic view of future volumes to guide commercial and logistics activities.

Integration factors endogenous and exogenous
The performance of forecasts relies on the intelligent integration of multiple data sources:
Interns:
- Sales history
- Promotional plans
- Prices and price changes
- Store locations
External:
- Competitive data
- Weather: sunshine, rain
- Special days: Christmas, Valentine's Day, Mother's Day...
- Exchange rates, inflation, etc.
BOOPER MPS consolidates these factors to produce realistic and contextualized scenarios.

Calculation elasticities and product interactions
BOOPER MPS automatically estimates:
- Price elasticity by product and point of sale
- Cross elasticities (substitution and complementarity)
- Threshold and break effects
This modeling allows strategic price levels to be established.

Clustering points sales
BOOPER MPS automatically segments stores according to their sales behavior:
- Commercial performance
- Price sensitivity
- Customer typology
- Competitive environment
- Local seasonality
Strategies can thus be differentiated by store cluster rather than a uniform approach.

Simulations with rules
BOOPER MPS allows you to test different hypotheses before their actual deployment:
- Alignment with the competition
- Price or margin variation
- Price corridor
- Impact of chaining
- Etc.
Each simulation measures the projected impact on:
- Competitive positioning
- Revenue
- The margin

Alerts intelligent and proactive management
BOOPER MPS identifies and alerts users in the event of:
- Price variation: purchase, competitor price,
- Deviation from objectives: Significant margin deviation, inconsistency in product range
- Optimization opportunities detected by AI
Pricing becomes a proactive rather than reactive process.

Reporting and analysis performance comparison
BOOPER MPS offers advanced management tools:
- Customizable dashboards
- Monitoring markdown KPIs (sell-through, margin, velocity)
- Comparison between stores, regions, and categories
- Time analysis of markdown campaigns
- Exports for finance, supply chain, and senior management
Teams have a clear, shared, and actionable view of inventory reduction performance.
 Price simulation
BOOPER MPS incorporates a price simulation engine (PSS) based on elasticity and AI to measure the impact of a pricing scenario on volume, revenue, and margin. It combines historical data, forecasts, and business rules to manage multiple objectives under constraints and support operational decision-making.
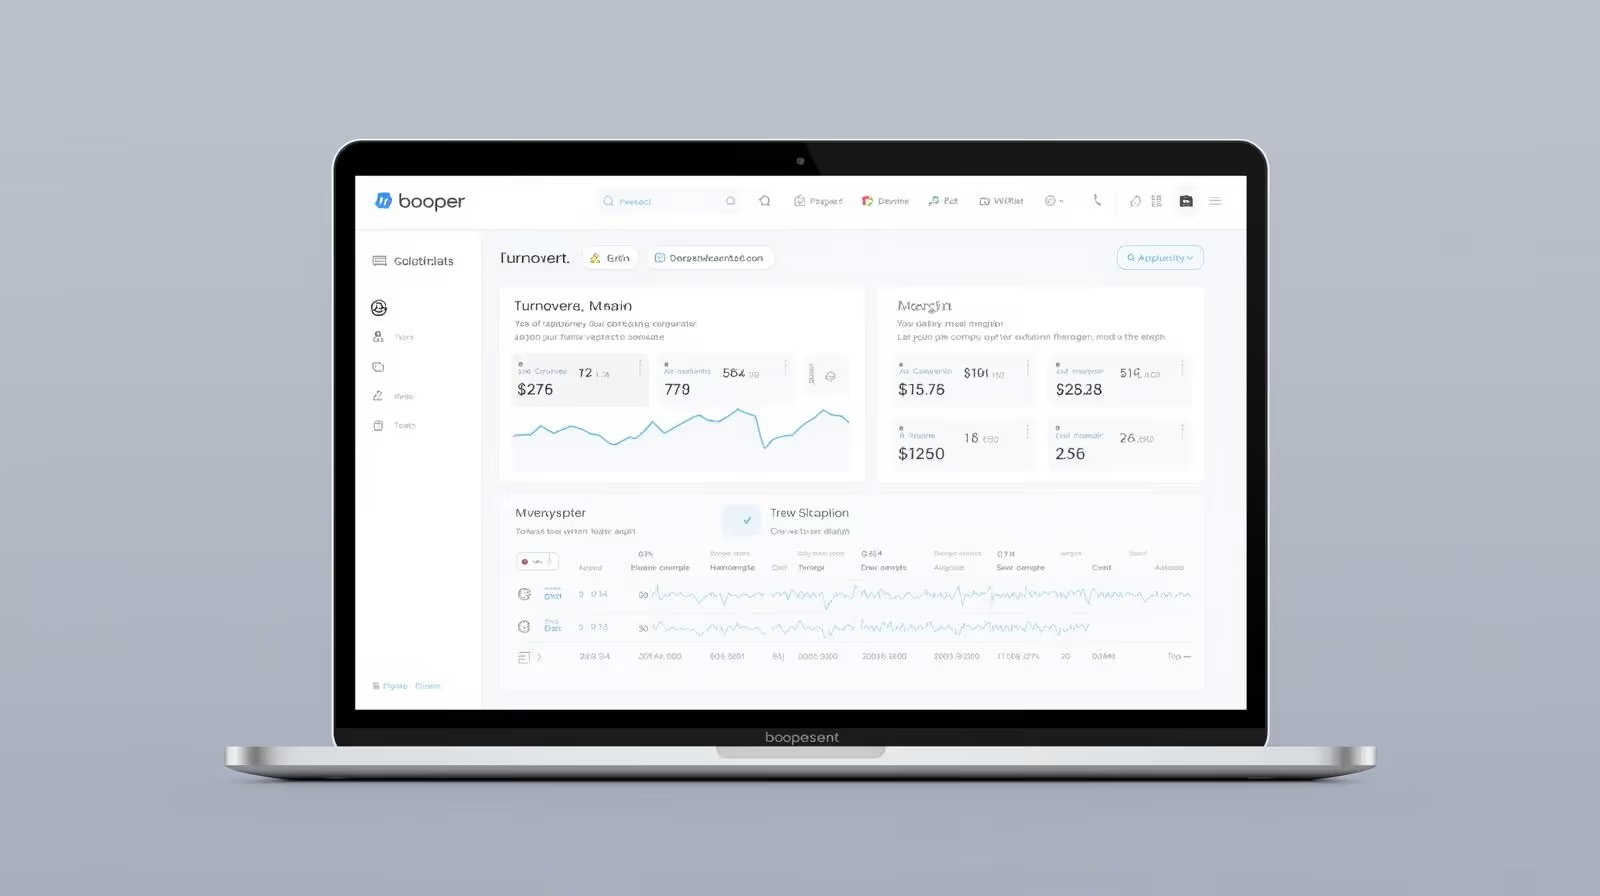
 Geopricing and Price Tiers
BOOPER MPS manages geo-pricing and price tiers. Prices are simulated and optimized according to elasticity levels, margin targets, and business constraints, ensuring global consistency, local differentiation, and multi-level performance management.

 Assortment management
BOOPER manages assortments according to formats, zones, and channels, integrating packaging sizes, sales forecasts, and product life cycles. Margin simulations enable decisions to be made on whether to introduce or withdraw products based on economic performance and profitability targets.

 Governance and management
BOOPER secures pricing decisions through structured governance based on explainable models, business rules, and complete traceability of simulations. Multi-level validations ensure strategic consistency, risk control, auditability, and control of margin and performance variances.

How does artificial intelligence improve the accuracy of sales forecasts in retail?
Artificial intelligence improves the accuracy of sales forecasts by simultaneously analyzing large volumes of historical and contextual data to identify patterns that human analysis or traditional statistical methods struggle to detect. It takes into account, for example, seasonality, promotions, prices, weather, and competition to produce dynamic, continuously updated forecasts. This approach differs from traditional forecasting methods, which rely primarily on averages and past trends and struggle to incorporate multiple variables simultaneously. Machine learning, on the other hand, processes hundreds of variables in parallel and detects nonlinear relationships—such as the combined effect of a competitor’s promotion and a weather-related spike on a given category—that a linear approach cannot capture. The other key difference is the ability to continuously adapt: unlike a static statistical model, which is recalibrated only occasionally, a machine learning model incorporates new sales data in real time and adjusts its forecasts as consumer behavior evolves—changes in purchasing habits or breaks in seasonality are thus identified more quickly than with a static model. For a retailer, this increased accuracy directly supports decisions that depend on sales forecasts—such as inventory planning, the scale of promotional campaigns, and pricing decisions—since a reliable forecast reduces the risk of a poorly calibrated price adjustment, whether it involves a price increase or a markdown.
What data is needed to set up an AI sales forecast?
MPS primarily uses historical sales data, prices, promotions, sales calendars, store data, and external factors such as weather, events, or competition. The richer the data, the greater the accuracy of the models—a minimum of one year of historical data is generally recommended to capture a full seasonal cycle. Historical sales data remains the most critical factor: it allows the model to learn the unique patterns of each product and each store—its seasonality, its response to past promotions, and its price sensitivity. Commercial calendar data (promotions, holidays, special campaigns) helps distinguish one-off effects from underlying trends, thereby preventing exceptional peaks or troughs from skewing the forecast. External drivers—weather, local events, competitor activity—then refine the forecast for the categories most sensitive to these factors, though they are not essential at the project’s outset: BOOPER can generate actionable forecasts using basic sales and calendar data, then gradually enrich the model as other sources are connected via the Data Loader. For a supply chain or pricing team launching an AI-powered forecasting project, the main challenge is therefore less about having all possible data available from day one and more about ensuring a sufficiently long and clean sales history—at least one year—so that the model can learn a full cycle rather than a truncated portion of the business.
What is the difference between a traditional statistical forecast and a machine learning forecast?
Traditional statistical forecasting methods rely on past averages and trends, applied relatively uniformly to sales history. Machine learning, on the other hand, incorporates hundreds of variables simultaneously, detects nonlinear relationships among them, and automatically adapts to changes in consumer behavior. This difference is evident in how each approach responds to an atypical event: a traditional statistical method tends to extrapolate an average trend and fails to anticipate a disruption—such as a weather-related spike in demand, the combined effect of a promotion and a holiday, or a lasting change in purchasing habits. Machine learning, by cross-referencing more signals (historical data, seasonality, promotions, prices, external context), captures these interactions with greater precision and adjusts its forecast accordingly. The other difference lies in the explainability of the results: at BOOPER, the forecasts produced by the machine learning model are accompanied by the factors that explain them, allowing teams to understand why a forecast changes—rather than simply seeing the number. This transparency is essential for business teams to validate, adjust, or challenge a recommendation with full knowledge of the facts, rather than blindly following a “black box.” For a retailer, this shift from traditional statistical forecasting to machine learning-based forecasting has a direct impact on the reliability of the resulting procurement and pricing decisions: the more accurately the forecast captures the reality of purchasing behavior, the less the downstream decisions rely on approximation.
How does sales forecasting help optimize inventory and the supply chain?
A more accurate sales forecast allows orders to be adjusted as closely as possible to actual demand, which automatically reduces two opposing problems: stockouts, which negatively impact the service rate, and excess inventory, which ties up cash and often ends up being marked down. MPS generates these forecasts by analyzing sales history, seasonality, promotions, and contextual factors, with sufficient detail—by product and by store—so that procurement teams can adjust their orders category by category, rather than applying a uniform safety margin across the entire product range. The forecasts remain transparent, making it possible to understand why an order volume changes and to make informed adjustments. This link between forecasting and the supply chain naturally extends to pricing: an unexpected out-of-stock situation or overstock often results, downstream, in a forced markdown or a last-minute promotional campaign decided in a rush. By reducing these supply discrepancies upstream, sales forecasting also limits pricing decisions made under pressure rather than based on a chosen strategy. For supply chain management, this predictive approach reduces the working capital tied up in inventory and improves the customer service rate—two metrics that, taken together, have a direct impact on the network’s overall profitability.
What is the ROI of an AI-based sales forecasting solution?
An AI-based sales forecasting solution generates a measurable return on investment across several areas directly linked to forecast accuracy: reduced stockouts and excess inventory, optimized order volumes, less time spent by teams on manual forecasting, and an overall improvement in alignment between forecasting, procurement, and pricing. The link to pricing is particularly significant: more reliable forecasts reduce the risk of poorly calibrated price adjustments—such as price increases that crush demand because the sensitivity of that demand was not anticipated, or markdowns triggered too late because a slowdown in sales was not foreseen. This benefit directly impacts margins and price perception—two metrics closely monitored by any sales department. Time savings represent another tangible benefit: teams that previously built their forecasts manually—product by product or category by category in spreadsheets—can now reallocate that time to analysis and decision-making rather than to generating numbers. Forecasts are then automatically adjusted as new sales are recorded, which minimizes the need for manual revisions during the period. The actual magnitude of the ROI, however, depends on the quality of the available data and the frequency of decision cycles specific to each retail chain: the more comprehensive the sales history and the more frequent the inventory or pricing decisions, the faster the increased forecasting accuracy translates into measurable gains in margin and inventory levels.
Is the solution suitable for complex, international store networks?
Yes. MPS is designed for large retail accounts, offering multi-country, multi-store, and multi-category management combined with centralized forecast governance, while maintaining local flexibility tailored to each market. This multi-country management takes into account the fact that demand behaves differently from one market to another—with varying seasonality, country-specific promotional calendars and holidays, and price sensitivity that varies according to local purchasing power. The predictive engine incorporates these specificities on a market-by-market basis rather than applying a single model across the entire network. Centralized governance enables group management to maintain a consolidated view of forecasts across the entire network, which is useful for balancing supply priorities between markets or standardizing methods across subsidiaries, without imposing assumptions on local teams that are ill-suited to their own markets. For a multi-country group, this balance between central management and local granularity is what makes the forecast truly actionable on a market-by-market basis, rather than a consolidated average that is of little use for operational decision-making.
Is the solution suitable for small store networks?
Yes. MPS is also designed to be adopted by organizations smaller than large national or international companies. The terminology and metrics used in the tool remain those of the client, and the quality of the forecasting algorithms remains the same as in larger organizations. This adaptability stems from the very nature of the predictive engine: it learns from the data specific to each retail network, regardless of its size, rather than applying a generic model calibrated for large volumes. A network of a few dozen stores therefore benefits from forecasts tailored to its business reality—its own sales cycles, its own seasonality, its own flagship categories—without needing a volume of data comparable to that of a national chain. The deployment is also designed to remain proportionate: integration via the Data Loader adapts to existing data flows, which avoids imposing an integration project—scaled for a large corporation—on a smaller organization. The methodological support provided helps teams, which often lack in-house data science expertise, interpret the results and structure their decision-making processes. For a mid-sized chain, the challenge is the same as for a large enterprise: to move beyond rough forecasts—whether done by hand or in a spreadsheet—to achieve greater reliability in procurement and pricing decisions—without letting the size of the organization hinder the quality of predictive management.
Solutions
Pricing Optimization Software
A pricing tool focused on margin performance and effective business governance.
Sales forecasting using AI
Anticipate demand and improve your business decisions with AI
Product matching: Cloning and chaining
Make your product comparisons more reliable with AI
Promotion management
Manage your promotions with precision and maximize their profitability
Markdown and Clearance Sale
Optimize your markdowns and accelerate the sale of your inventory
Studies & Data
Price surveys and web scraping
Monitor your competitors' prices online and offline
Diagnosis Price
Optimize your pricing strategy and secure your decisions
Price strategy development
Use your pricing strategy as a lever for creating sustainable value
Council
Operational Pricing Consulting
Bring clarity and control to your pricing decisions
Change management
Make your teams the driving force behind your pricing transformation
Pricing Training
Develop your operational or strategic skills

Lorem ipsum dolor sit amet, consectetur adipiscing elit. Suspendisse varius enim in eros elementum tristique. Duis cursus, mi quis viverra ornare, eros dolor interdum nulla, ut commodo diam libero vitae erat. Aenean faucibus nibh et justo cursus id rutrum lorem imperdiet. Nunc ut sem vitae risus tristique posuere.
Lorem ipsum dolor sit amet, consectetur adipiscing elit. Suspendisse varius enim in eros elementum tristique. Duis cursus, mi quis viverra ornare, eros dolor interdum nulla, ut commodo diam libero vitae erat. Aenean faucibus nibh et justo cursus id rutrum lorem imperdiet. Nunc ut sem vitae risus tristique posuere.
Heading 1
Heading 2
Heading 3
Heading 4
Heading 5
Heading 6
Lorem ipsum dolor sit amet, consectetur adipiscing elit, sed do eiusmod tempor incididunt ut labore et dolore magna aliqua. Ut enim ad minim veniam, quis nostrud exercitation ullamco laboris nisi ut aliquip ex ea commodo consequat. Duis aute irure dolor in reprehenderit in voluptate velit esse cillum dolore eu fugiat nulla pariatur.
Block quote
Ordered list
- Item 1
- Item 2
- Item 3
Unordered list
- Item A
- Item B
- Item C
Bold text
Emphasis
Superscript
Subscript