
Bullwhip Effect: The Ripple Effect Along the Price Chain
On this page
Do your orders amplify your sales fluctuations?
Let's plan an exchangeLearn About AI-Powered Sales ForecastingThe bullwhip effect refers tothe amplification of fluctuations in demand as one moves up the supply chain. A small change in consumption leads to more pronounced discrepancies at the retailer level, even greater discrepancies at the wholesaler level, and significant fluctuations at the manufacturer level, with each link in the chain amplifying the signal as a precaution.
The Essentials in 6 Questions
An amplification of fluctuations in demand throughout the supply chain.
Supply, purchasing, suppliers, and pricing for markdowns.
After a peak or a dip in demand, especially when lead times are long.
In any chain with multiple links.
It creates excess inventory that ends up on clearance.
Share actual sales data, reduce lead times, and improve forecasting.
Why the bullwhip effect is weighing on prices
Because any excess inventory created by overstocking eventually ends up on clearance.
- Understanding artificial amplification: a small change in demand leads to erratic orders upstream.
- Anticipate excess inventory that requires markdown decisions.
- Ensure the success of procurement negotiations by factoring this volatility into forecasts.
Concrete example: +5% in demand, +40% in production
A 5% increase in yogurt sales leads to production that is 40% above normal, and then to excess inventory.
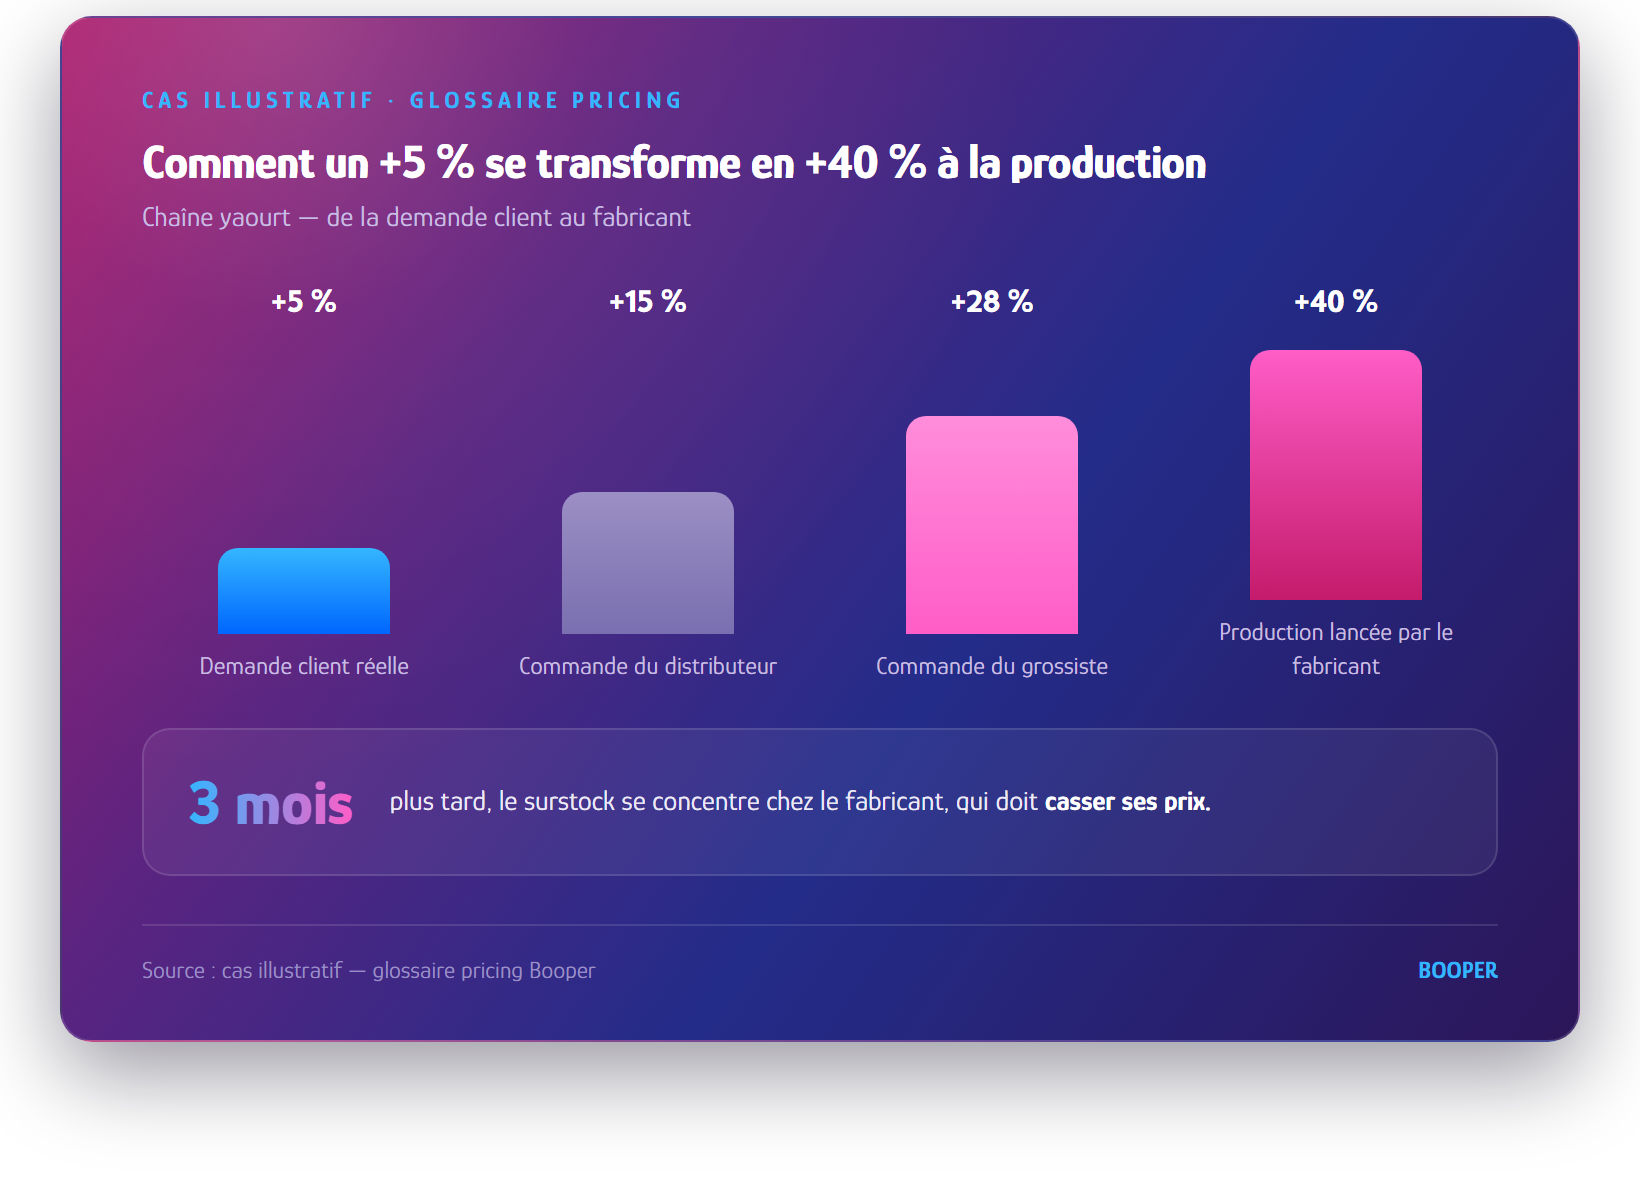
| Link | Reaction |
|---|---|
| Consumers | A 5% increase in demand following a news article |
| Distributor | A 15% increase in orders to replenish inventory |
| Wholesaler | A 28% increase in orders, based on projections |
| Producer | A 40% increase in production, with a 6-week lead time |
Three months later, the trend fades: the producer is left with a surplus of inventory and has to slash prices.
How can we limit the bullwhip effect?
Three actions: share information, shorten turnaround times, and better distinguish between trends and noise.
Share Actual Sales
Connecting all the links: collaborative planning, EDI.
Reduce lead times
The effect is proportional to the cycle time; just-in-time production structurally limits it.
Plan Better
Models that distinguish a real trend from an artificial spike.
Our AI-powered sales forecast makes this signal more reliable; if excess inventory does occur, our “markdown and markdown ” program implements a gradual price reduction rather than a forced fire sale. Carefully measuring price elasticity in retail helps calibrate these markdowns (see also: how to calculate price elasticity using data).
The 3 Mistakes That Exacerbate the Bullwhip Effect
Overreacting, maintaining excessively large safety stocks, or compartmentalizing information.
- Overreacting to an isolated fluctuation without considering the broader context.
- Safety stock levels that are too high, based on worst-case scenarios.
- Segregate information between purchasing, supply chain, and pricing.
Frequently Asked Questions
Short answers to the most frequently asked questions about the bullwhip effect.
What is the bullwhip effect?
The bullwhip effect refers to the amplification of fluctuations in demand as one moves up the supply chain: a small fluctuation in final consumption leads to more pronounced variations at the retailer, the wholesaler, and finally the manufacturer.
Does the bullwhip effect affect all sectors?
Yes. Any multi-tier supply chain is vulnerable to this, from food to home improvement, including household appliances and pharmaceuticals. The extent of this risk, however, varies depending on two factors: the length of the supply chain—since each intermediary adds its own safety margin to orders—and replenishment lead times, which require planning further in advance and thus increase the likelihood of errors. A short supply chain with frequent deliveries significantly mitigates this issue.
How can we measure its scope?
Using the variance ratio: we compare the variance in orders placed upstream to that of final sales over the same period. A ratio close to 1 means that orders closely track consumption. The further the ratio deviates from 1, the greater the amplification; if it remains high period after period, it is due to the organization of the supply chain rather than a one-time event. The calculation is performed stage by stage to identify where the amplification begins.
Can AI reduce the bullwhip effect?
Yes, on two conditions. The models must be trained on granular data—by product and by retail location—rather than on aggregates that mask actual variations. And the resulting forecasts must be shared with suppliers; otherwise, everyone will continue to base their decisions solely on orders received and add their own safety margin. An excellent forecast kept in-house does not reduce upstream amplification.
What is the connection between the bullwhip effect and promotions?
Promotions are a major driver of this. A spike in sales caused by a promotion is initially interpreted as a sustained increase in demand, which leads to a surge in orders, then in inventory, and finally to markdowns when demand falls. Isolating the promotional effect from underlying demand is the first step in correcting this, before making any changes to the supply chain.
Does the bullwhip effect have an impact on pricing?
Yes, and it happens at the end of the cycle. The excess inventory created by over-production results in markdowns, often made in a hurry and at a higher rate than necessary. Some of the end-of-season discounts, therefore, do not stem from a pricing error but from a forecasting error that originated several months earlier.
How can a retailer minimize the bullwhip effect?
Three strategies work in tandem: sharing actual demand at the point of sale rather than just orders; shortening replenishment cycles to reduce the forecasting horizon; and spreading out sales operations rather than concentrating them. The first is the most effective and the least expensive to implement.
Key Takeaways
- The bullwhip effect amplifies fluctuations in upstream demand.
- It creates excess inventory that ends up on clearance.
- We minimize it by sharing information, reducing delays, and planning more effectively.
Would you like to minimize the "whiplash effect" on your forecasts?
Booper makes your sales forecasts more reliable to smooth out supply chain disruptions.
Let's talk about your forecasts →Learn About AI-Powered Sales ForecastingThese articles can interest you

AI transforms sales forecasting by precisely separating baseline demand from promotional uplift. This granular SKU-by-store analysis enables real-time inventory adjustments and margin optimization. A key finding: the use of predictive solutions can reduce spoilage of perishable goods by up to 15%.
The goal of BOOPER’s AI-powered Sales Forecasting module is to implement this SKU-level granularity by store: to guide scenarios and drive growth without compromising price positioning.

A stockout is never an isolated incident: it’s the result of an inaccurate forecast made earlier, and pricing plays a role on three levels, not just one. It can be the cause when a promotion or price reduction is launched without taking available inventory into account. It becomes the consequence when excess inventory is managed through a poorly controlled pricing reflex—such as selling off stock too quickly or, conversely, maintaining a high price based on perceived scarcity. And it remains—all too often overlooked—the quickest lever for curbing demand before the shelf runs empty. A previously published Booper article on forecasting mechanics treats stockouts as input data that needs to be cleaned from the historical record. This article approaches the problem from the other end: stockouts as a quantifiable business consequence of a failed forecast (including pricing) and as the starting point of a vicious cycle that skews sales history, compromises the next forecast, and triggers the next stockout.

A sales forecast that relies solely on historical data and price overlooks a real and measurable portion of demand—the kind driven by the weather, a holiday, a trend going viral on social media, or a competitor opening a store 500 meters away. The Booper guide on forecasting methods and KPIs barely touches on the subject in a single line (“optional: weather, traffic, competition”). This isn’t optional for everyone, and—more importantly—it doesn’t apply the same way to everyone: the weather can account for more than half the sales variance in one category, yet have almost no effect on another. This guide details the four categories of exogenous events and, most importantly, a method for determining which ones are worth incorporating.
Incorporating these signals without overcomplicating the model—that’s what BOOPER’s AI-powered sales forecasting does: every forecast deviation remains explainable—it’s never a black box.