
Price elasticity: definition, calculation, examples

Hugues Lafitte
CEO and Founder
May 28, 2026
To measure price elasticity, it is necessary to analyze sales sensitivity in response to price variations. This key metric optimizes profitability without sacrificing volume. It helps identify margin-expansion opportunities on inelastic products while safeguarding price perception on sensitive items. A score of -1.5 thus reveals a high demand responsiveness.
The calculation of price elasticity is a key indicator that measures the percentage change in sales volume resulting from a 1% change in a product's price.
However, many retailers risk eroding their margins or losing market share by changing their pricing without anticipating how their customers will actually react. This article helps you understand this metric so you can identify your strategic products and optimize your pricing decisions both in-store and online.

Price elasticity: a simple definition (in 30 seconds)
Price elasticity measures the percentage change in sales volume resulting from a 1% change in price. This sensitivity indicator, which is often negative, guides decisions on margin increases or the protection of loss leaders.
Moving from a vague hunch to a growth strategy requires mastering this tool.
What exactly does it measure?
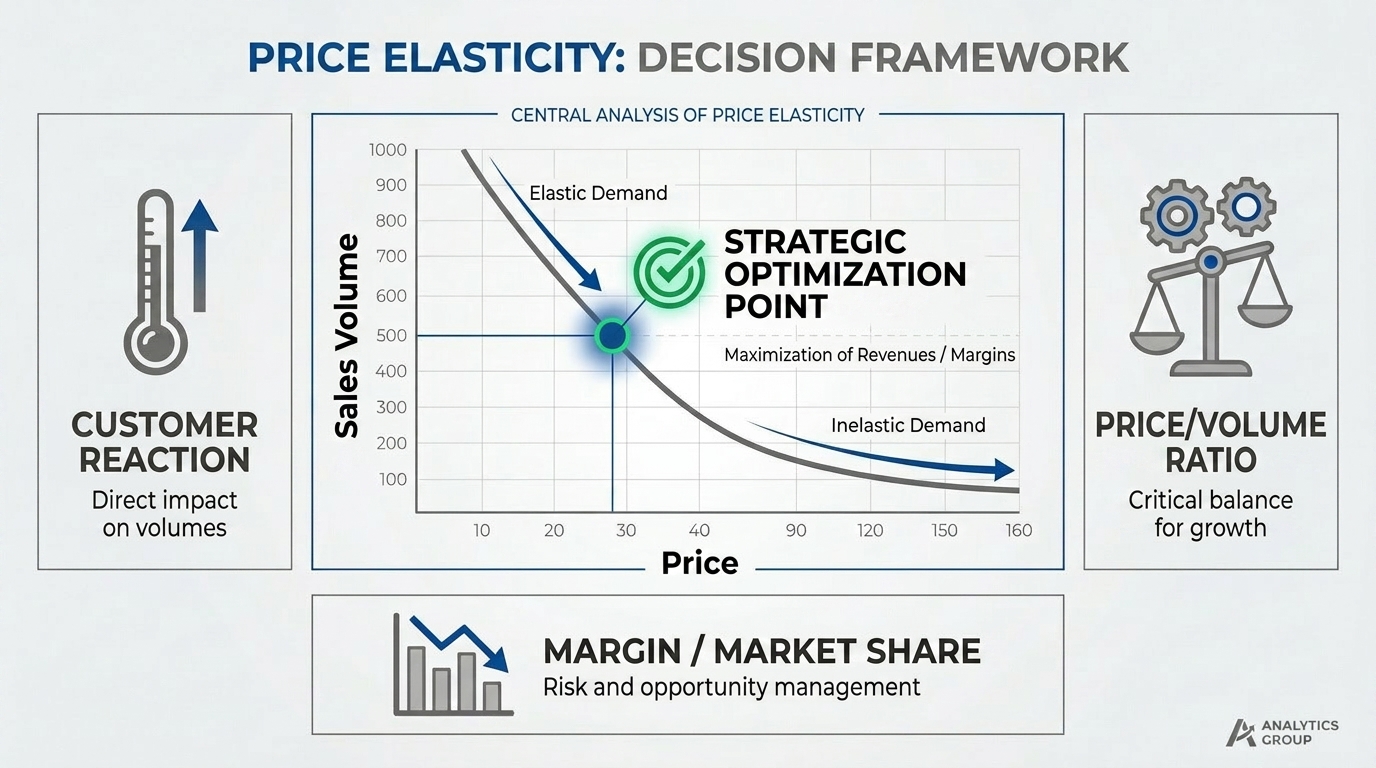
Price elasticity serves as a barometer of customer response. It helps predict whether a price increase will drive buyers away or whether demand will remain stable.
It is a ratio between the cause (price) and the effect (volume). According to the WHO, it precisely quantifies how consumption responds to price fluctuations in the market.
It shows the change in the quantity consumed. This simple calculation reveals just how vulnerable your sales are.
Why this is key to pricing decisions
What's at stake is your profitability. Without this measure, you risk eroding your profit margin or losing market share due to a lack of understanding of your customers.
It’s the perfect decision-making tool. It lets you simulate various scenarios before changing a label in-store or online.
This eliminates the need to wing it. You can manage a catalog of thousands of items with ease and without stress.
How to interpret price elasticity (high, low, positive/negative)
Once the definition is established, you need to know how to interpret the numbers so you don't make a mistake in the diagnosis.
High elasticity: risk of volume
A price elasticity greater than 1 (in absolute terms) indicates high sensitivity. Even a slight price increase causes sales to drop sharply.
This is a classic example of a highly competitive market. Customers switch suppliers just to save a few pennies.
We are talking here about "elastic" products. Caution is advised in these segments.
This is the average price elasticity measured based on 1,851 estimates from 81 consumer goods studies (Bijmolt, Van Heerde & Pieters, Journal of Marketing Research, 2005).
Low elasticity: a “safer” margin
If the score is close to zero, demand is inelastic. Customers will buy regardless of the price, often out of necessity or loyalty.
This is where the opportunities for margin growth lie. Volume will remain stable despite the increase.
The INSEE study INSEE on fuels clearly illustrates this rigidity in consumption.
Why Elasticity Is Often Negative (and Exceptions)
Generally speaking, when prices rise, demand falls. It’s simple math. But be careful with luxury or high-end products. In these rare cases, a high price can actually make the product more appealing to buyers.
This is known as the Veblen effect. Price then becomes a marker of social status.
How to Calculate Price Elasticity (Simple Method)
You don't have to be a math whiz to come up with a first usable figure.
Simplified formula: % change in quantity / % change in price
Divide the change in sales by the change in price. This is the basis for any retailer’s calculations. This gives you a direct coefficient.
Stick to percentages to maintain consistency. This makes it possible to compare carrots and televisions without getting confused by the units.
Avoid complex econometric models. Simplicity is key for immediate action. The goal here is operational efficiency, not an academic thesis.
Quick example with numbers (10→11€, 1000→850)
Your product's price increases from 10 to 11 euros, a 10% increase. Your sales drop from 1,000 to 850 units, a 15% decrease in volume.
The calculation yields -15% / +10% = -1.5. The elasticity is high, so you’ll see a significant drop in volume with this product.
This example shows that even a small increase can be costly. Always calculate the impact on overall revenue to validate your strategy.
Regular-price elasticity vs. promotional elasticity
Price flexibility varies between regular-priced items and sale items. Customers react more strongly to immediate and temporary discounts than to fixed prices.
A promotion creates a sense of urgency. It artificially boosts price elasticity over a short period, as the opportunity seems rare and limited.
Be sure to distinguish between these two metrics. Failing to do so could skew your annual forecasts and future margins.
French consumers say that sales are a key factor in choosing where they buy their groceries (IFOP, July 2023).
Why price elasticity varies so much in retail
Context changes everything, and the same product can be perceived differently depending on the place or time.
Category / Brand / Positioning
Essential goods are often inelastic. People don’t stop buying bread just because the price goes up by a few cents. Demand remains stable.
Conversely, premium national brands face competition from private-label brands. Positioning determines price sensitivity. If the price is too high, customers will opt for the cheaper alternative.
The more unique a product is, the less price-elastic it is. That is the strength of the brand.
KVI vs. Long Tail
Customers keep a close eye on KVI (Known Value Items). A price increase here will instantly damage your reputation for value. Consumers remember these benchmark prices and are constantly comparing them.
"Long-tail" products or niche products are more resilient to fluctuations. Customers pay less attention to them. Comparisons are more complex and less frequent.
Manage these two categories using radically different strategies. Prioritize volume over KPIs.
Channel (store / e-commerce / marketplaces)
Online, comparing prices takes just a few seconds. Price elasticity is therefore much higher than in brick-and-mortar stores. The complete transparency of the online market increases price volatility.
In a physical store, the customer is already there. They are often willing to pay a slightly higher price for the service. The immediacy of the purchase makes up for any price difference.
Adjust your pricing structures based on the touchpoint. Be more aggressive online.
Competition, inventory, seasonality
If your competitor lowers their prices, your own price elasticity skyrockets. Inventory also plays a role: stockouts skew sales data. Finally, seasonality affects how customers perceive value depending on the time of year. The weather also influences purchasing decisions.
A toy in December is less price-sensitive than one in the middle of March. The scarcity and urgency of the season reduce price sensitivity.
Incorporate these external variables to clean up your historical analyses. Use tools to Pricing Optimization Software to isolate these biases.
Table: Level of elasticity → Recommended decisions
To help you understand better, here’s how to translate those numbers into concrete actions for your catalog.
| Level of elasticity | Product Profile | Recommended action | Risk |
|---|---|---|---|
| Low (|E| < 0.5) | Essentials or luxury | Gradual increase | Price image |
| Average (0.5 < |E| < 1.2) | Standard goods | Conservative tests | Decline in volume |
| Strong (|E| > 1.2) | Comfort, competition | Targeted promotions | Erosion of margins |
| Positive (Veblen) | Prestige | High prices | Trivialization |
Low elasticity: cautious increase + monitoring
You have free rein to test out increases. Take it step by step so as not to disrupt established routines.
Keep a close eye on the volume after each change. Rigidity sometimes has hidden limits.
This is the key to quickly restoring your profit margins.
Average elasticity: testing + segmentation
Here, precision is key. Segment your customers or geographic areas to refine your tests.
Don't change everything all at once. Use control groups to measure the actual impact.
The balance between volume and value is delicate for these items.
High elasticity: KVI protection + competition control
With these products, you need to be aggressive or in line with the market. Don’t let the gap with the market widen.
These items are often used to attract customers. Losing volume here will leave your stores empty.
Think of them as marketing investments rather than profit centers.
How to Apply Price Elasticity in Practice (4 Use Cases)
Let’s move beyond the theory and see how pricing experts use this tool on a daily basis.
1) Adjust prices without affecting sales volume
The goal is to find the "sweet spot." This is the price that maximizes your margin without driving customers away. This way, you avoid undermining your profitability based on mere intuition.
Price elasticity gives you the upper limit you shouldn't cross. It's your safety net to prevent a massive drop in sales.
Take it one step at a time. Focus on low-sensitivity items.
2) Define/update KPIs (image-price)
Identify the products with the highest elasticity. These are often your future bestsellers. These items are the ones your customers remember when assessing your competitiveness.
By lowering the prices on these items, you improve the overall perception of the brand. This is a powerful psychological tool for driving foot traffic to the store.
It's a branding strategy. It 's driven by the bottom line.
3) Create more profitable promotions (uplift/cannibalization)
Calculate the uplift needed to offset the discount. If the promotional elasticity is too low, the promotion will result in a net loss. The additional volume will never cover the investment made in terms of margin.
Be careful not to cannibalize sales of other products. Don’t rob Peter to pay Paul by simply diverting existing sales.
The promotion must generate actual additional sales. It must be measurable.
4) Manage Markdown & Clearance Sales (End-of-Season)
At the end of the season, the goal shifts: you need to clear out inventory. Use price elasticity to determine the right discount. If it’s too low, the inventory will remain unsold and clutter your shelves. If it’s too high, you’re giving customers an unnecessary advantage when the product would sell just as well with a smaller discount.
This is a weekly management process. We make adjustments based on actual cash outflows.
Optimized markdown turns a burdensome liability into immediate cash flow. This frees up cash for new collections.
Biases That Skew Elasticity (and How to Avoid Them)
Be careful: numbers can sometimes be misleading if you forget to clean up the raw data before deciding on a price.
| Bias | Symptom | Recommended correction |
|---|---|---|
| Stockouts | Zero sales despite stable pricing. | Exclude periods when items are out of stock from the calculation. |
| Special offers | Artificial sales spike caused by couponing. | Isolate the elasticity of “bottom of the shelf” vs. promotional items. |
| Seasonality | High sales during periods of high demand. | Seasonally adjust volumes using historical data. |
| Competition | Decrease in volume with no change in internal pricing. | Include the relative price difference (price index). |
Out of Stock & Availability
If the product isn't on the shelf, sales drop to zero. It's not a matter of price, but purely a matter of logistics. You can't gauge the desire to buy a product that isn't there.
The algorithm might assume infinite elasticity. It is essential that you exclude periods of disruption from your calculations. Otherwise, your demand forecasts will be completely skewed.
Availability is a prerequisite. It is the foundation of any reliable analysis.
Deals/coupons/bundles
Bundled offers make it difficult to determine the unit price. Customers no longer respond to the base price but to the overall package being offered. This creates a specific purchasing behavior that obscures the reality.
Exclude promotional sales to determine true price elasticity. It is important to distinguish between sensitivity to the regular price and the appeal of a one-time promotional offer.
Don't lump everything together. Distinguish between one-time and regular purchasing behavior.
Cannibalization & substitution
If the price of Product A increases, customers often switch to Product B. The price elasticity of Product A appears to be high, but sales volume remains stable within the category. As a result, overall revenue may remain flat.
Always analyze cross-elasticity among similar products. This is crucial for product portfolio management. You need to understand how your own products are taking market share away from one another.
Look at overall performance. Analyze the results by product family.
Season / Events / Merchandise
A prime shelf spot boosts sales without changing the price. If you raise the price at the same time, the price elasticity will appear to be zero. This is a dangerous false positive for your future pricing decisions.
Weather conditions or sporting events can also create artificial spikes. These external factors drive demand regardless of your pricing strategy.
Isolate these external factors. This is the only way to obtain a pure and actionable sensitivity measurement.
Checklist: Before Changing a Price
Before you save your new schedule in the ERP system, go through these checkpoints.
10 key metrics (data, inventory, competition, goals, etc.)
Follow this checklist to ensure your price launches go smoothly. Every item you overlook poses a financial risk to your department. A mistake with a flagship product could erode your profit margin or damage your pricing reputation.
- Verification of the reliability of historical data (data gap filling).
- Analysis of price elasticity calculated over the past 12 months.
- Current positioning relative to direct competitors.
- Level of inventory available to meet a potential spike in demand.
- Estimated impact on overall gross margin.
- Impact on price perception (whether or not the product is a KVI).
- Current seasonality (is this the right time?).
- Risk of cannibalization of the rest of the product line.
- Clear objective: volume, revenue, or margin?
- Contingency plan in case sales drop more than expected.
Accuracy in execution is just as important as the quality of the calculation. Don’t leave anything to chance before clicking.
Conclusion
Price elasticity is your best ally for navigating inflation without losing customers.
5-line summary + link toevaluation/demo
Understanding price sensitivity allows you to manage your margins with precision. It’s a practical tool for optimizing your promotions and KPIs. Anticipating customer reactions then becomes a strategic advantage.
Want to take it a step further? Request a pricing assessment to analyze your product catalog and identify growth opportunities.
Understanding price elasticity is essential for managing your margins and anticipating how your customers will react to price changes. Identify your inelastic products now to safeguard your profitability, and adjust your KPIs to protect your brand image. Optimize your pricing strategy to turn every price change into an opportunity for sustainable growth.
FAQ
Price elasticity measures the percentage change in sales volume resulting from a 1% change in price. It is a ratio between the cause (price) and the effect (volume), and is most often negative.
In retail, this is an essential metric for predicting whether a change to your price tags will boost your revenue or, on the contrary, drive your customers to the competition—a topic we explore in depth in our article on how to leverage price elasticity.
The average price elasticity, as measured across 1,851 estimates from 81 consumer goods studies, stands at -2.62, according to Bijmolt, Van Heerde, and Pieters (Journal of Marketing Research, 2005)—a reminder that price sensitivity is, on average, far from negligible.
Without this step, you risk eroding your profit margin with an ill-judged price increase, or leaving profit on the table out of a misplaced fear of a customer reaction that would never have happened.
There is no single "ideal" figure in absolute terms: it all depends on the objective for the product in question. Low price elasticity, close to zero (|E| less than 0.5), is ideal for increasing margins without losing customers—this is often the case for essential goods or luxury items.
Conversely, high elasticity (|E| greater than 1.2) may be desirable for a promotional campaign, where a small price reduction must generate a massive sales volume to be profitable.
There is even a case where elasticity becomes positive: the Veblen effect, in which a high price boosts a product’s appeal rather than dampening it, as price becomes a marker of social status in high-end market segments.
In short, the right price elasticity depends on the role the product plays in your strategy: an inelastic item lends itself to a gradual price increase, while an elastic item is best used for price protection or as a promotional tool —a point discussed in detail in our guide on price elasticity by product and store.
The simplest formula is to divide the percentage change in sales volume by the percentage change in price—stick with percentages to maintain consistency and be able to compare very different products without getting confused by units.
A numerical example illustrates the principle: a product’s price rises from 10 to 11 euros, or +10%, and its sales drop from 1,000 to 850 units, or -15%. The calculation yields -15% / +10% = -1.5, a high elasticity that indicates a significant loss in volume.
To obtain a reliable result, you must use recent, clean sales data and exclude exceptional periods—such as stockouts, promotions, and seasonal fluctuations—that could skew the calculation, as explained in our article on the comprehensive method for calculating elasticity.
Avoid complex econometric models when seeking an initial actionable figure: simplicity is key for immediate action, since the goal isoperational efficiency, not an academic thesis.
No, it's important to distinguish between the two. Promotional price elasticity is often much higher than regular-price elasticity because it incorporates a sense of urgency, prominent merchandising, and a feeling of immediate opportunity for the customer.
Consumer response is ten times greater during a promotion than in response to a permanent price change on the shelf—the opportunity seems rare and limited, which drives purchases beyond what the price level alone would justify.
This phenomenon has real significance: According to IFOP (July 2023), 60% of French people say that promotions are a key factor in choosing where they do their grocery shopping—see our article on promotional pricing strategies.
Mixing these two metrics would skew your annual forecasts and future margins: you need to exclude sales from promotions to determine the true price elasticity specific to that product line.
Price sensitivity varies depending on the product's essentiality and the availability of substitutes. Customers can easily compare the prices of the most common consumer goods, but they tend to remain more loyal to a luxury brand or a unique product—the more a product is perceived as indispensable or exclusive, the less price-elastic it is.
The distinction between KVI and long tail clearly illustrates this phenomenon: Known Value Items, which customers constantly remember and compare, see their price image destroyed almost instantly by a price increase, whereas niche products are much more resilient to price fluctuations—a topic we explore in our article on KVI and price image.
The sales channel also plays a role: online, comparing prices takes two seconds, which makes price elasticity much higher than in physical stores, where the immediacy of the purchase often compensates for a slight price difference.
Finally, competition, inventory, and seasonality affect perceived price sensitivity—a toy in December is significantly less price-elastic than one in the middle of March, as scarcity during that period smooths out the response to price.
It is essential to clean the historical data before performing any calculations. Exclude periods of out-of-stock situations, because a drop in sales caused by a product being out of stock has nothing to do with your pricing strategy—otherwise, the algorithm might assume infinite price elasticity when there is actually only a logistical issue.
Similarly, isolate seasonal spikes, end-cap placements, or weather events that artificially boost demand regardless of the price tag: raising a price during an external spike makes elasticity appear to be zero—a false positive that could be dangerous for your future decisions.
Cannibalization warrants the same level of vigilance: if the price of Product A increases and customers switch to Product B, the price elasticity of Product A appears to be high, even though overall revenue for the category may remain stable.
The use of tools to Pricing Optimization Software allows us to systematically isolate these factors to obtain a pure and actionable sensitivity measure, rather than a figure skewed by external effects—which we detail in our article on using AI to calculate elasticity on a product-by-product basis.
KVI, or Known Value Items, are the products on which customers base their perception of your brand’s pricing. They generally exhibit very high price elasticity, making them your key products to monitor closely—on this topic, see our article on which products to prioritize.
By identifying these products based on their price elasticity, you can decide to aggressively lower their prices to drive foot traffic to the store, while offsetting the loss in margin with more inelastic items from the rest of the catalog.
This approach is the opposite of the one applied to products with low price elasticity: for KVI products, the goal is not to restore a margin, but to view the product as a marketing investment rather than a standalone profit center.
A drop in volume for a KVI has a disproportionate effect: it empties the shelves and damages the overall price image far beyond the loss of revenue from that single item.
When it comes to managing thousands of SKUs, AI-based dynamic pricing solutions are the most effective: they automate elasticity calculations and suggest optimal adjustments in real time, whereas manual monitoring quickly becomes unmanageable once the number of products exceeds a few dozen.
Specialized platforms, such as Booper, offer dedicated modules that allow you to incorporate elasticity directly into pricing, promotional, and end-of-season markdown decisions, rather than calculating it separately in a spreadsheet that is disconnected from those decisions—this is precisely what Booper’s “ Pricing Optimization Software ” module covers.
These tools also help systematically eliminate common biases—discontinuations, promotions, seasonality, and cannibalization—which would be difficult to manage manually for a catalog containing several thousand SKUs.
The challenge, therefore, is not just to calculate a number, but to make it actionable on a day-to-day basis, product by product, without having to dedicate an entire team to this single task.
To learn more, discover a 6-step method for leveraging elasticity in retail, howAI builds robust elasticity models, or the 4 methods for measuring elasticity, from MVP to a robust model.

Building a high-performing pricing team requires adopting a hybrid model that combines central strategy with local agility. This transition replaces intuition with data-driven decisions, orchestrated by expert roles and strict governance.
This proactive management directly transforms financial performance, targeting profitability increases of 100 to 500 basis points.

Key takeaways: building a high-performing pricing team requires adopting a hybrid model that combines central strategy with local agility. This transition replaces intuition with data-driven decisions, orchestrated by expert roles and strict governance. This proactive management directly transforms financial performance, targeting a profitability increase between 100 and 500 basis points.

Key takeaways: building a high-performing pricing team requires adopting a hybrid model that combines central strategy with local agility. This transition replaces intuition with data-driven decisions, orchestrated by expert roles and strict governance.
This proactive management directly transforms financial performance, targeting profitability increases of 100 to 500 basis points.