Price elasticity: a simple method for leveraging it in retail (without any unnecessary complications)

Edouard Calliati
CMO - CRO
March 4, 2026
Key takeaway: Price elasticity measures how sensitive customers are to price changes, helping to optimize profitability. Identifying inelastic products allows you to adjust margins without sacrificing sales volume, while protecting key items helps maintain your price image.
A score above 1 indicates highly elastic demand, where any price increase is likely to cause sales to plummet.
Is it possible to optimize retail price elasticity without risking a loss of sales volume or profit margins simply because you lack visibility into how your customers will actually react? This approach allows you to finely tune your profitability and price positioning using a simple method, free from complex mathematical calculations.
This guide provides a six-step action plan to help you identify your strategic products, optimize your promotions, and turn your internal and external pricing data into profitable, concrete decisions that can be immediately applied to your own day-to-day operational and sales activities.

Price elasticity: a simple definition (and why it changes everything)
What price elasticity measures: the response of sales to a change in price
Price elasticity links your prices to your sales volumes. It serves as a gauge of customer sensitivity. Retail price elasticity helps you manage your KPIs without sacrificing your profits.
If prices rise, volume generally falls. That's a basic rule of business.
Every product reacts differently. Some are much more sensitive than others.
How to interpret this (concrete examples: -0.3 / -1.2 / -2.0)
A score of -0.3 indicates a weak reaction. Conversely, -2.0 indicates extreme sensitivity. Volume is falling twice as fast as the price is rising.
The negative sign is purely mathematical because the curves are opposite. Don't get bogged down in complicated formulas.
Interpretation of scores
- Score greater than 1: High sensitivity (elastic).
- Score less than 1: Low sensitivity (inelastic).
- Score of 0: Completely inelastic (essential goods).
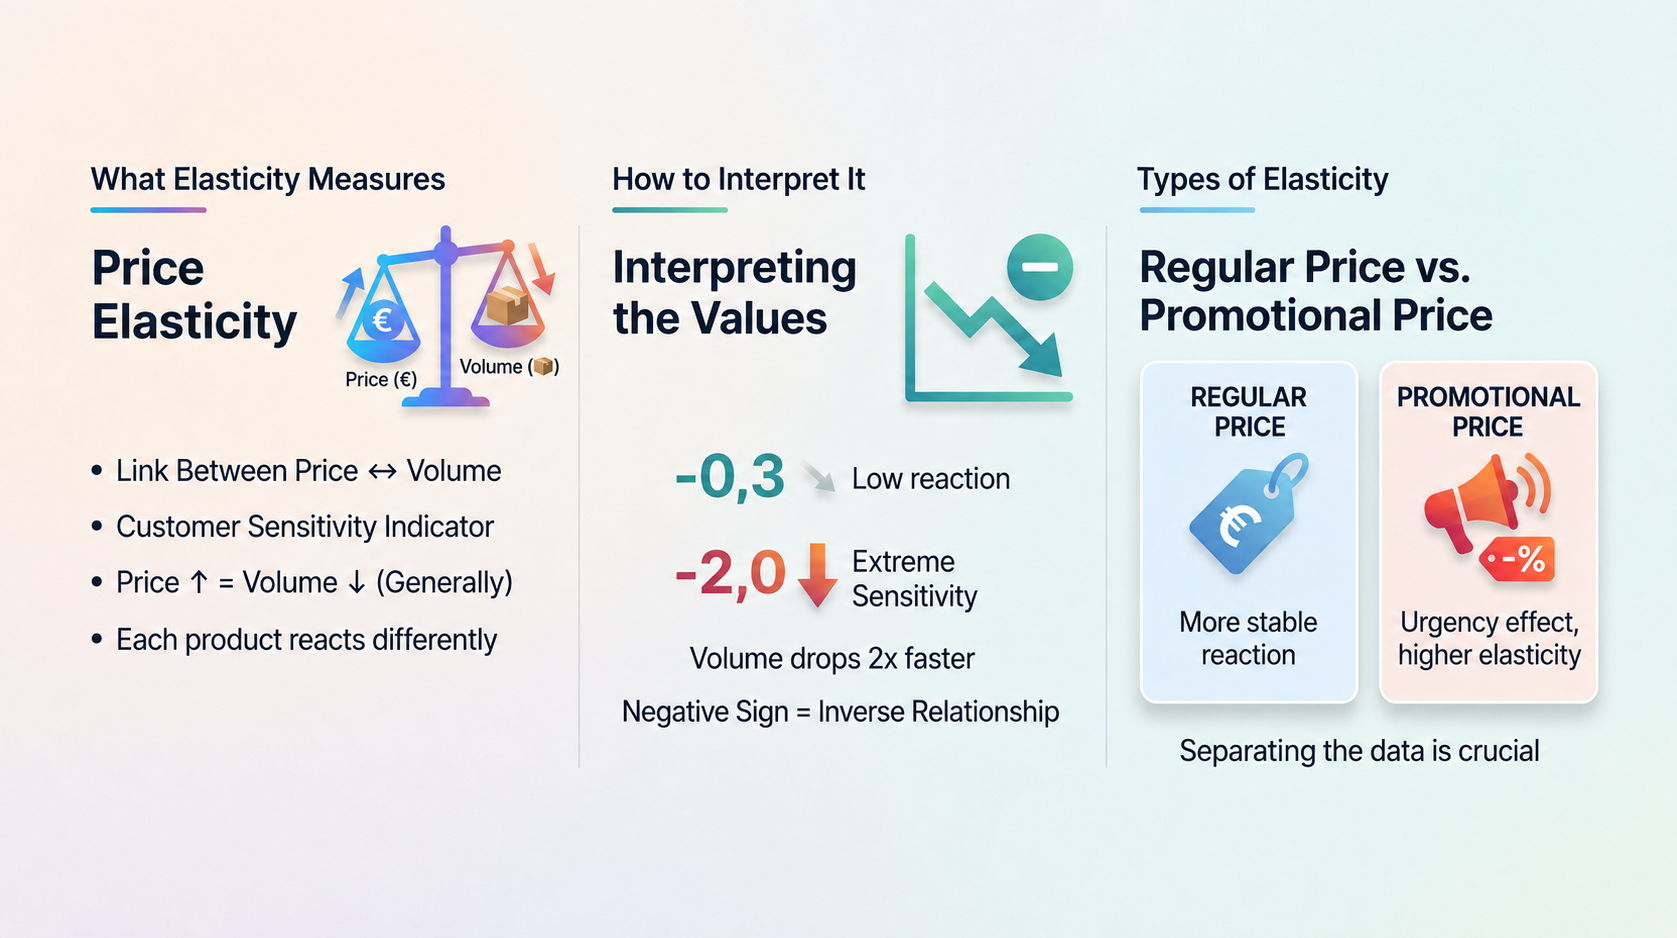
Regular-price elasticity vs. promotional elasticity
It’s crucial to distinguish between regular stock and promotional items. Customers react differently depending on the context. This is a key distinction.
The promotion creates a sense of urgency. Price elasticity is often much higher in such cases.
Separate these two data streams. Otherwise, your Markdown calculations will be inaccurate.
Why does price elasticity vary so much in retail?
You might think it's an exact science, but the reality on the ground is much more fluid.
Managing price flexibility in retail requires a delicate touch.
Cross-elasticity:
It measures how the price of a product, such as strawberry jam, affects sales of a substitute like raspberry jam. This is a key pricing metric.

Category / Brand / Positioning
Luxury doesn't come cheap. A strong brand is better able to absorb price increases, and the product category plays a huge role in your calculations.
Milk is more rigid than champagne. Basic needs dictate the laws of the market without mercy.
Analyze your segments. Don't lump everything together when you're testing.
KVI vs. long tail (price-to-image ratio vs. margin)
KVI products are the ones customers know inside out. Here, flexibility is at its highest. A pricing error is immediately noticeable. The long tail offers more freedom.
Manage your margins on niche products. Protect your brand image with must-have items. That’s the key to success for the savvy retailer.
Channel (retail store, e-commerce, marketplaces)
Online, comparing prices is a breeze. Price flexibility is often much greater than in physical stores. The customer is just a click away.
The store offers an experience and immediacy. This takes some of the pressure off the price. But don't overdo it either.
Competition, availability, seasonality
If your neighbor lowers their prices, your price elasticity changes. The weather also influences purchasing decisions. It is a powerful and unpredictable external factor.
When a competitor runs out of stock, your sales will increase—even if your price is higher at that moment.
Take these biases into account. They often explain the anomalies in your sales charts.
A Simple 6-Step Method for Estimating Elasticity (Without Data Science)
You don't need a PhD in math to get started—here's how to do it using common sense and Excel.
Step 1: Select the scope (category + 20–100 products)
Don’t try to cover the entire catalog all at once. Choose a cohesive and representative category. Between twenty and one hundred items are more than enough to get your first usable results.
Choose products that sell consistently. Avoid items that sit on the shelves. You need some turnover to get a clear picture of how your regular customers are responding.
Step 2: Ensure data accuracy (net price, inventory, out-of-stock items, promotions)
Clean up your data before running calculations. A net price includes any immediate discounts. Exclude periods when items are out of stock so as not to skew your actual sales statistics.
If the product isn't there, the sale is off. It's not a matter of price, but of availability.
First-party data is the key. Without it, you're headed for disaster.
Step 3: Create comparable periods (same week in the previous year, same season, etc.)
Compare like with like. Don’t compare Easter Monday to a regular Monday. Use data from the previous year to smooth out the peaks. Seasonality is a classic pitfall in retail.
Isolate seasonal effects. Unusual weather conditions can also skew your analysis. Stay alert to these details that make all the difference.
Step 4: Measure Δprice and Δvolume (before/after)
Note the percentage change. If the price increased by 3%, how did the volume change? Carefully record these two figures for each item in your selected sample.
Try this exercise with several price changes. The more data points you have, the more reliable the trend. It’s purely empirical, but incredibly effective in practice.
Step 5: Simplified calculation + classification (low / medium / high)
Divide the change in volume by the change in price. Then group your products into categories. Create three simple categories for your team to make future pricing decisions easier.
The "weak" ones are your low-margin allies. The "strong" ones require constant attention, because even the slightest mistake can cost you a lot in revenue.
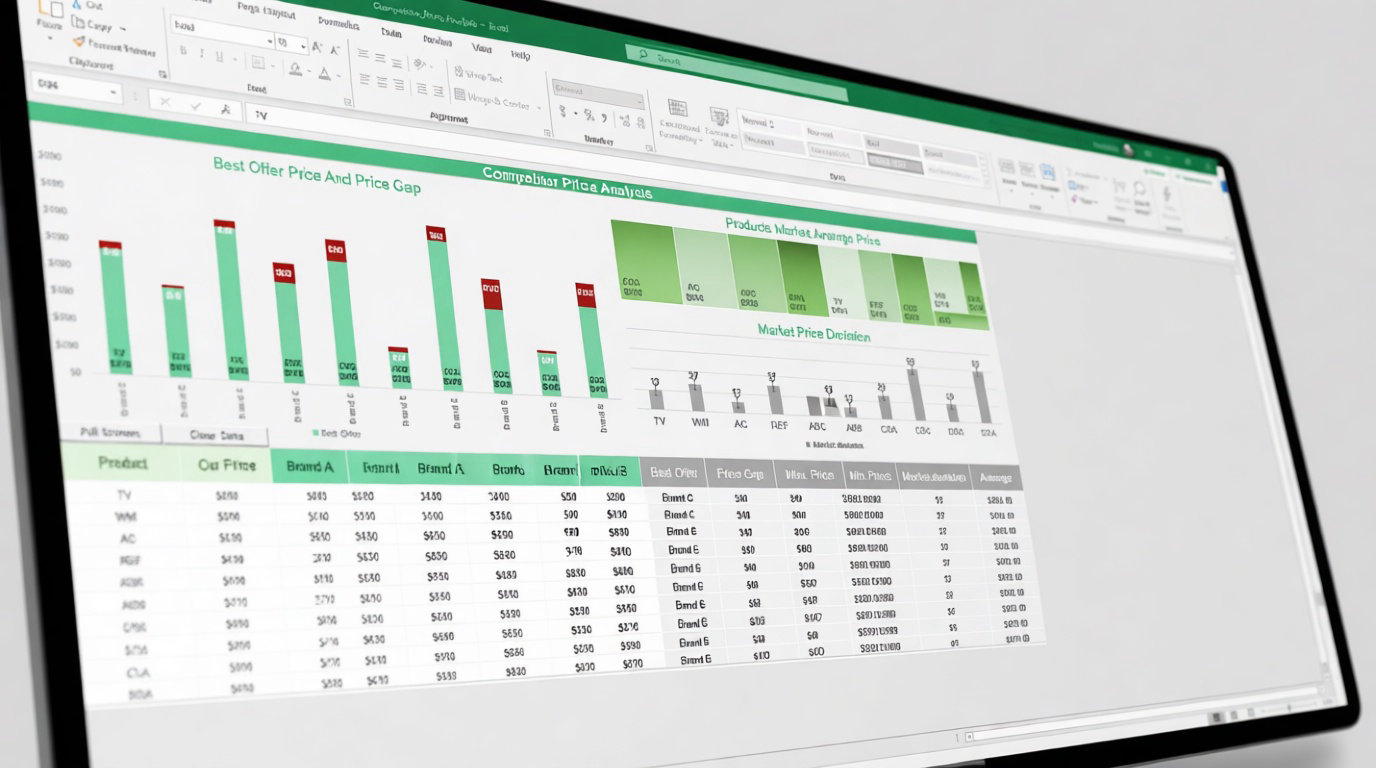
Put this into a table. It makes it much easier to quickly decide on the next steps.
Level of flexibility → recommended decision
Example of a concrete calculation
Original price: €20 | New price: €24 (+20%)
Initial sales: 2,500 units | New sales: 2,000 units (-20%)
Result: -1.25 (Elastic demand)
Step 6: Turn into decisions (rules + safeguards)
Set clear limits. Never go below an acceptable minimum margin. Your pricing strategy must remain consistent with your brand positioning so as not to lose customers or credibility.
Here is your checklist before approving a change in price elasticity for your strategic products or KPIs:
- Check the gross margin after the increase
- Monitor the price of the leading competitor
- Ensure consistency with the rest of the product line
Table: Price elasticity → Recommended pricing decisions
To get a clearer picture, let’s summarize the strategy you should adopt based on your customers’ behavior.
Low elasticity: margin / cautious increase possible
Here, customers are loyal or captive. You can test small price increases without significant risk. This is your department’s profit center, far removed from aggressive markdowns. But don’t get too greedy either.
Still, keep an eye on your sales volume every week. It takes a long time to rebuild trust. Take it one step at a time to ensure your profitability in the long run.
Average elasticity: tests + segmentation
The market is in a gray area. We need to test key psychological levels. Sometimes, a round number can completely change how the market is perceived.
Segment your stores if possible. Test on a small group before rolling out the changes using the BOOPER management tools.
Learn from every attempt. That’s how you make progress without needlessly burning your wings in the face of competition.
High resilience: KVI protection + competitive intelligence
Immediate danger. Even a single penny too much will scare buyers away. You need to be in line with the market and aggressive, especially on your strategic KPIs.
How to use it in practice (retail use case)
Theory is all well and good, but let's see how that translates into your day-to-day work as a category manager.
Adjust the regular price without affecting sales volume
The current inflationary pressure is forcing your hand. Price elasticity allows you to target specific items for price increases without scaring everyone off. It’s a matter of survival for your profit margins.
Above all, don’t touch the most sensitive keywords. Instead, focus on making subtle adjustments to accessories or long-tail products.
Customers will be more receptive to it. This will help keep your sales volumes steady.
Define KPIs and the price-image strategy
Your KVI products act as true ambassadors. Their flexibility confirms which ones really matter to the end customer. Above all, don’t fight the wrong battle. A poor price on a KVI item instantly destroys your overall pricing credibility with buyers.
Use this data to lock in your low prices. Promote these specific items aggressively. That’s where the battle for retail is won.
Creating more profitable promotions (uplift vs. cannibalization)
A 20% discount must generate actual additional sales. If customers are just buying at a lower price, you’re losing money. That’s what the uplift effect is all about.
Watch out for internal cannibalization. If a promotion on Product A kills sales of Product B, the net gain is zero. Cross-price elasticity helps you see the big picture.
Calculate your actual net profit. Never look at revenue alone.
Manage Markdown & Clearance Sales (End-of-Season / Slow-Moving Items)
To clear out inventory, you need to make a bold move. Price elasticity tells you whether a 30% discount will be enough. There’s no point in slashing prices if the product doesn’t respond to price cuts.
Speed up markdowns on highly elastic items. They’ll sell out quickly and free up space on your shelves for new arrivals.
Optimize your cash flow. That is the ultimate goal of your markdown strategy.
Errors That Skew Elasticity (and How to Avoid Them)
Be careful: numbers can be misleading if you overlook the operational context.
Out of stock / Availability
An empty shelf means no sales. It’s not a matter of prices being too high. It’s simply a pure and simple logistical failure.
Take those days out of your statistics. They skew your averages and your decisions.
Always check inventory levels. That should be your first instinct.
Non-isolated promotions and coupons
A hidden discount coupon throws off the calculations. The price at the register is no longer the same as the listed price. If you overlook these discounts, the calculated price elasticity will be inaccurate. You’ll be led to believe there’s an imaginary decrease in price sensitivity.
Include all loyalty benefits. The customer sees only the final price. That is the only reality of their purchase.
Cannibalization and substitution effects
Lowering the price of the six-pack affects the unit price. You're just shifting sales volume within the product line. That's not growth.
Always look at the overall category. One product can very easily overshadow another.

Analyze sales data. That's where the truth lies.
Changes to the product lineup / display / merchandising
A product displayed at the front of the store sells better. Price doesn't matter at that point. Location often trumps price.
If you change the shelf layout, wait before taking measurements. The customer needs time to get reoriented.
Merchandising is a powerful tool. Don't confuse it with elasticity.
30-Day Action Plan: Start Small, Then Build Momentum
Don't just sit there staring at your screens—get started with this monthly program.
Week 1: Data audit + scope selection
Identify your internal data sources. Select a product line that is performing well. Verify that price elasticity data is available.
Set aside seasonal items for this initial test. Stick to staple items to keep things simple.
Prepare your base file. The structure must be flawless at this stage.
Week 2: Initial calculations + segmentation
Apply the ΔV/ΔP formula without striving for absolute perfection. The idea is to identify trends. Divide your products into three groups based on their scores. That’s your first victory.
Identify any obvious anomalies. Sometimes, an unusual number indicates a data entry error. Clean up the data again if necessary.
Week 3: Rules + Scenarios
Imagine price changes. What happens if I increase Group A by 2%? Simulate the impact on your total margin.
Set your boundaries. Don't play with fire when it comes to KVIs.
Review these scenarios with your management team. Transparency helps avoid unpleasant surprises.
Week 4: Pilot + Monitoring
Actually change a few prices. Monitor sales on a daily basis. Make adjustments if the reaction is too severe or unexpected.
Here are the key points to keep in mind when creating your future Markdown documents:
- Daily volume report
- Weekly Margin Analysis
- Comparison with the previous year
- Feedback from field teams

Flexibility is for making decisions, not for doing math
Finally, remember that this tool is just a compass, not the captain of the ship.
Resilience is a driver of growth. It should guide your day-to-day decisions. Don’t get bogged down by complex numbers.
What matters most is taking action on the ground. Test, measure, and learn from your mistakes. That’s how you’ll build a solid pricing strategy. Retail is a lesson in humility, and customers always have the final say.
Control pricing flexibility with BOOPER tools.
Here are the keys to your success:
- Flexibility is a guideline, not an absolute rule
- Data must be clean to be useful
- Practical experience always trumps theory
Price elasticity is your guide for balancing volume and margin: by segmenting your products based on their price sensitivity in retail, you can safeguard your KPIs and profitability. Try these adjustments today to manage your revenue and better understand your customers’ responsiveness. Drive sustainable growth in your sales performance.
Frequently Asked Questions
Still have questions? Here are the answers to the most frequently asked questions.
To automate this tracking, read our article on pricing workflow alerts.
To understand the process, please review our project pricing methodology.

Building a high-performing pricing team requires adopting a hybrid model that combines centralized strategy with local agility. This transition replaces intuition with data-driven decisions, guided by specialized roles and strict governance.
This proactive management directly improves financial performance, enabling companies to aim for an increase in profitability of between 100 and 500 basis points.

Facing a sudden drop in conversion rates because your competitors are adjusting their prices in real time means you need to equip yourself with the best data-driven retail pricing strategy tool for 2026 to stay competitive. Price transparency in 2026: Retailers are automating pricing to protect their margins against inflation, improve omnichannel responsiveness, and generate a quick ROI.
Discover how these tools automate your specific business rules while ensuring complete strategic control over your brand image and delivering a measurable return on investment in less than six months.
This detailed comparison analyzes specialized platforms capable of predicting price elasticity and managing your omnichannel inventory to turn every piece of raw data into immediate, tangible profit.

Product matching is the foundation of competitive monitoring because it prevents the comparison of non-equivalent products. Reliable matching safeguards margins by basing repricing on real-time, multi-source data.
Key finding: According to the Diamart study, 50% of French retailers still consider this challenge to be unresolved.