
Price elasticity of demand: definition, formula, calculation

May 28, 2026
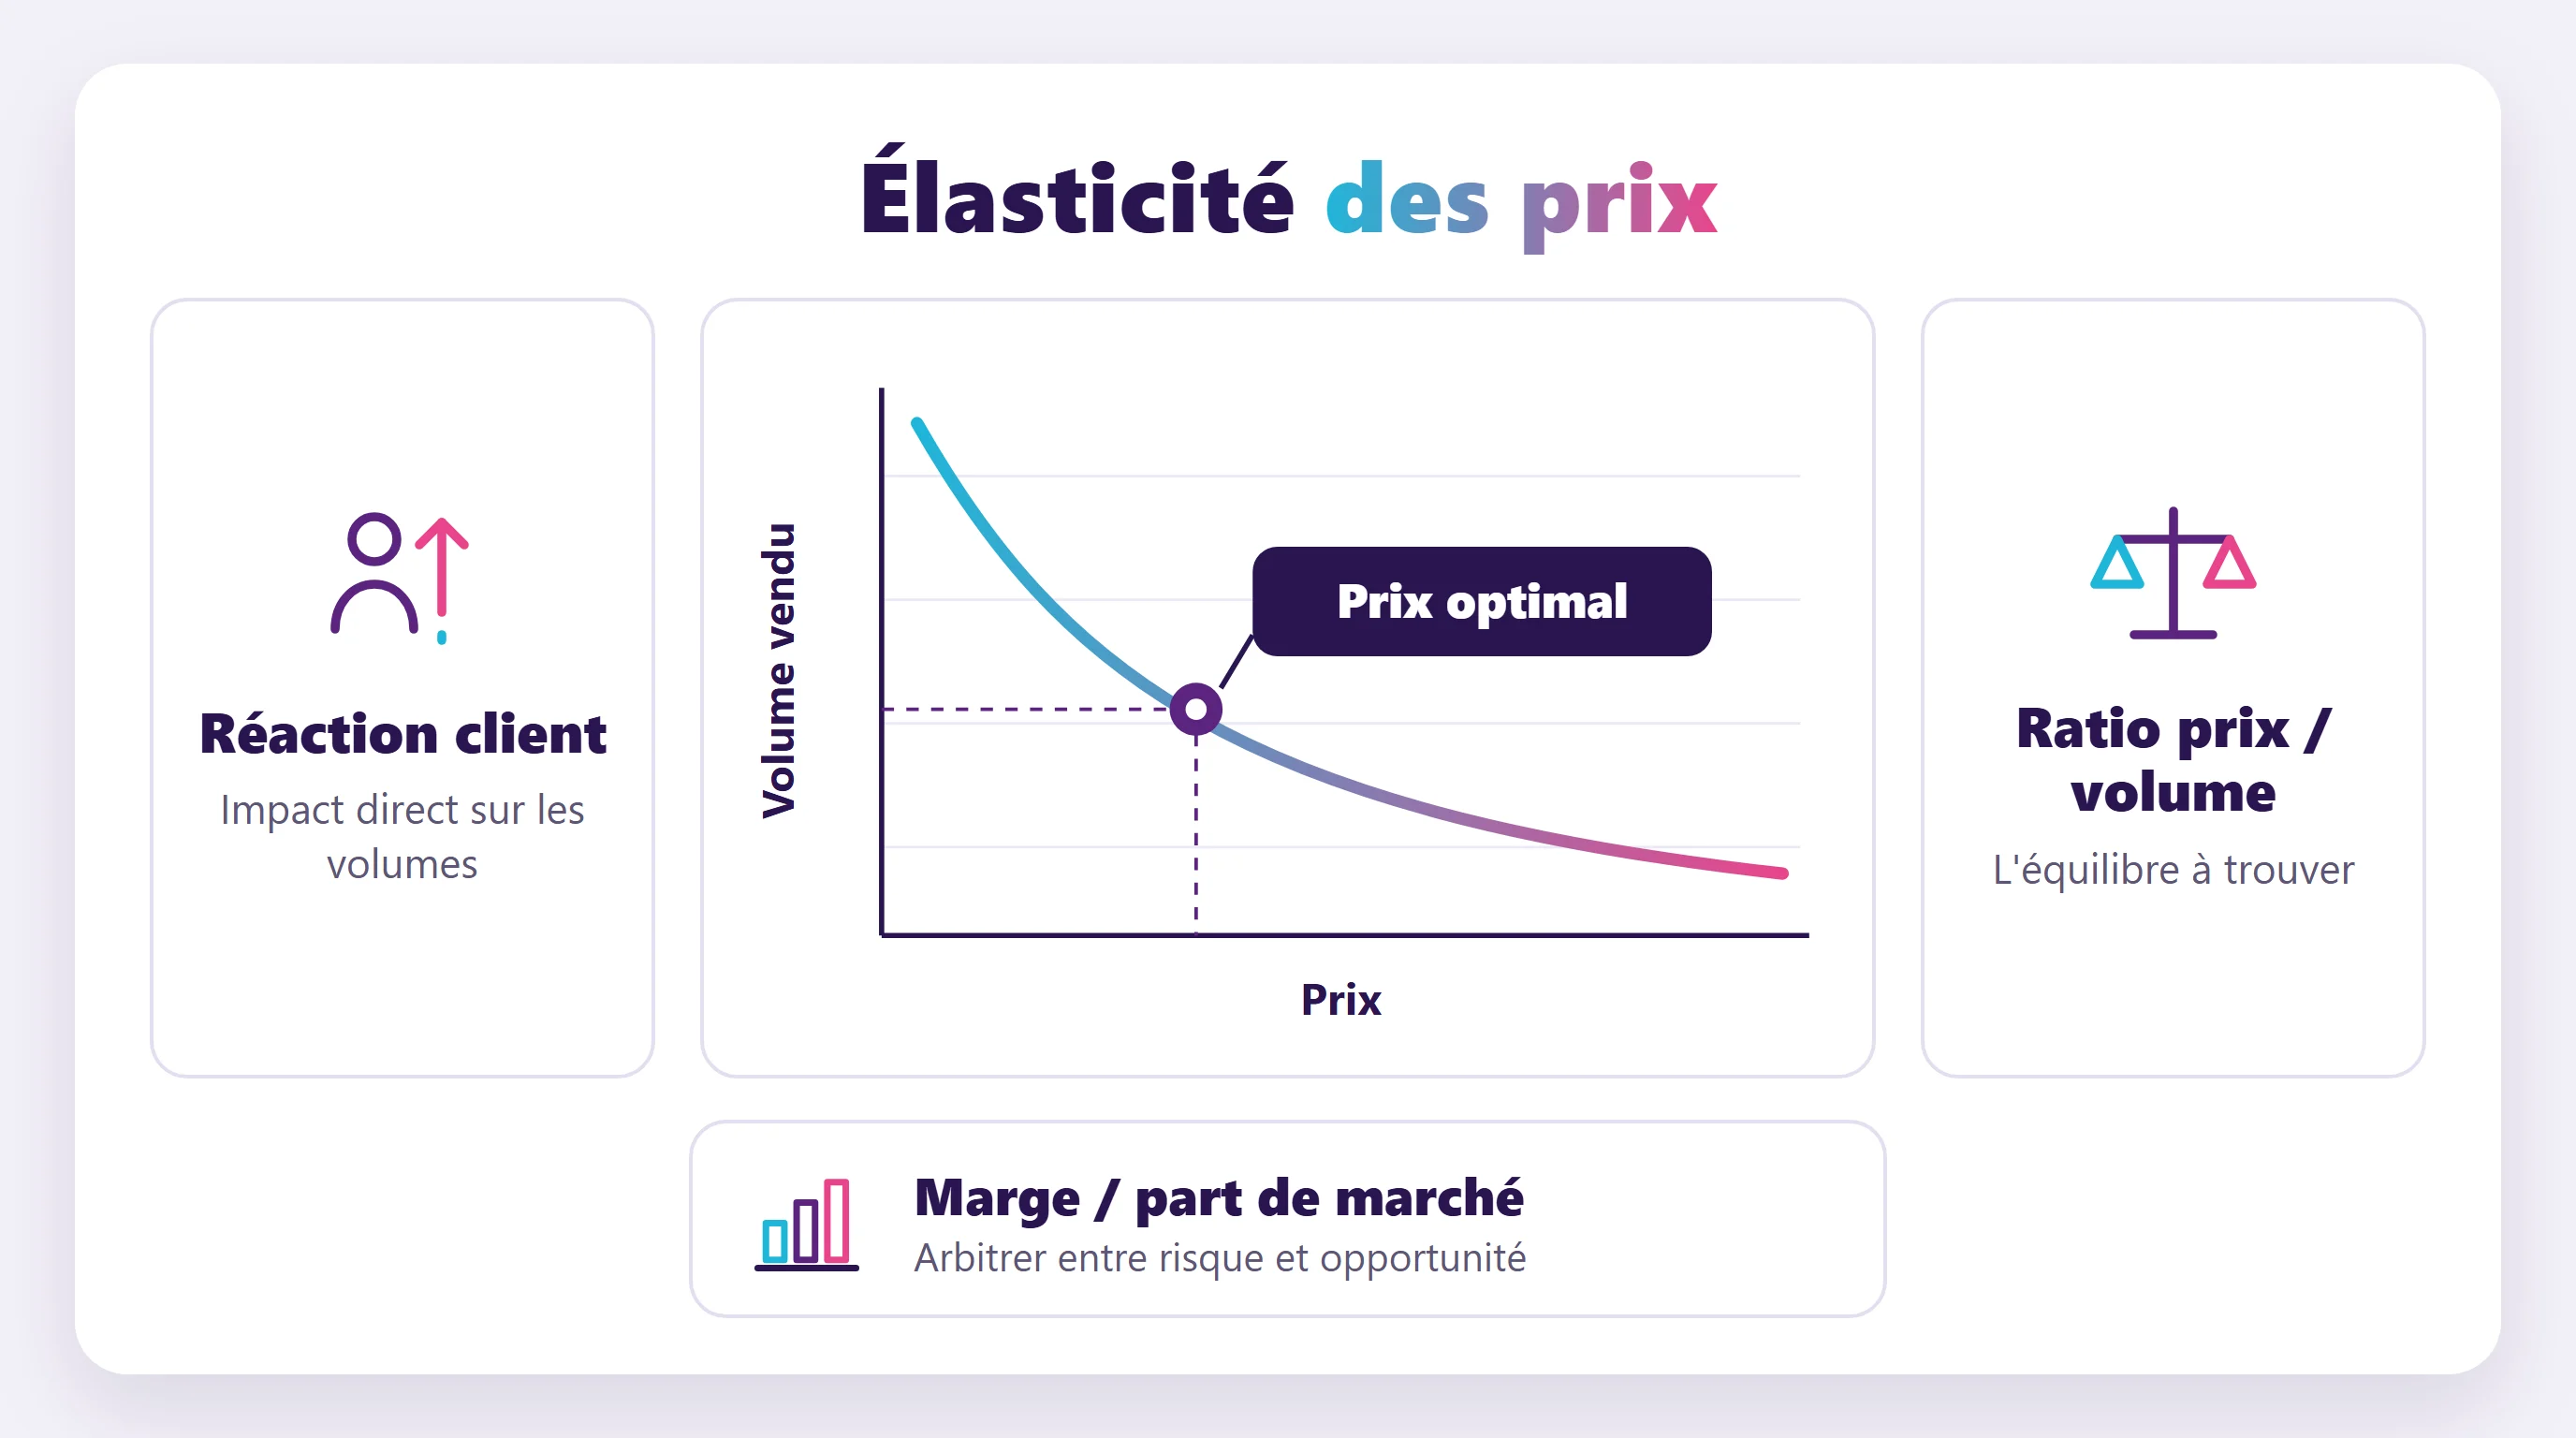
Price elasticity measures the change in volume relative to the change in price: at -1.5, a 1% price increase results in a roughly 1.5% decline in volume. It is measured excluding promotions and stockouts, preferably by store cluster.
The threshold of 1 distinguishes price increases that reduce revenue from those that do not—not those that erode profit margins. With a 25% price- Gross margin, a 10% price increase remains profitable up to an elasticity of approximately -2.9.
Price elasticity of demand measures the percentage change in sales volume when the price of a product changes by 1%.
It is the most frequently cited pricing metric—and one of the most misunderstood: its best-known threshold, 1, refers to revenue, not margin. This guide explains the formula, how to interpret it, what makes the metric reliable, and how to use it to make decisions.

Price Elasticity of Demand: Definition
Price elasticity of demand, or price elasticity, measures the percentage change in the quantity sold of a product when its price changes by 1%.
It is almost always negative: when the price rises, sales fall. An elasticity of -1.5 means that a 1% increase results in a loss of approximately 1.5% in volume.
We also talk about price sensitivity. It is the most frequently cited indicator in pricing—and one of the most misunderstood, as we will see below.
Price Elasticity Explained in 1 Minute
Read the video transcript
Does the salt cost ten centimes? You buy it anyway.
A pair of jeans is five euros off? That's enough to make you give in!
The same move regarding the price... but opposite reactions.
This sensitivity has a name: price elasticity. It measures how much sales change when the price changes.
The calculation fits on one line: the percentage change in sales divided by the percentage change in price.
Let's take jeans, for example: from fifty to forty-five euros, minus ten percent. Sales have gone from one hundred to one hundred thirty per week—a thirty percent increase!
Elasticity: minus three.
When the value is greater than one, the product is elastic: the customer reacts strongly. When the value is close to zero—as with salt or bread—the customer buys the product almost no matter what.
The catch? Measuring elasticity in the middle of a sale.
End-cap displays, posters: the response is huge! At the usual price, customers are much less responsive.
With Booper, the AI estimates the price elasticity of each SKU without confusing it with the season or the weather. It then simulates sales and margins before any decision is made.
Price elasticity: Know who will react before changing a price. Keep this in mind!
How to Calculate Price Elasticity: Formula and Example
The Price Elasticity Formula
Elasticity = change in quantity (in %) ÷ change in price (in %), or ((Q2 − Q1) ÷ Q1) ÷ ((P2 − P1) ÷ P1).
Using percentages makes it possible to compare unrelated products—such as a bottle of oil and a television—without getting confused by the units.
The result is called the elasticity coefficient. It is often expressed as an absolute value, denoted by |E|, to compare products with one another.
Example with figures: from 10 to 11 €
A product's price rises from €10 to €11, an increase of 10%. Its sales drop from 1,000 to 850 units, a decrease of 15%.
The elasticity is -15% ÷ +10% = -1.5. Demand is elastic: quantity responds more strongly than price.
Regular-Price Price Elasticity vs. Promotional Price Elasticity
Customers do not react the same way to a regular shelf price as they do to a temporary discount. The promotion creates a sense of urgency and draws attention to the item, which amplifies the response.
French consumers say that sales are a key factor in choosing where they do their grocery shopping.
(IFOP, July 2023)
The two measures are calculated separately. Combining them gives the impression that a product is more price-sensitive than it is during the rest of the year.
Calculate the price elasticity of your products
Enter two prices and the quantities sold at each price. Add the cost of goods sold to see how the change affects your margin—not just your revenue.
Free Calculator · Price Elasticity
Here, you enter two points. BOOPER calculates the elasticity of each product based on your sales, including cannibalization.
Measuring the Elasticity of Your ProductsElastic or Inelastic Demand: How to Interpret the Figure
If the absolute value is greater than 1, demand is said to be elastic: the quantity demanded changes more than the price. If it is less than 1, demand is inelastic: customers buy roughly the same amount despite the price increase.
The table below summarizes the five possible interpretations of the number.
| Value | Type of request | After a 10% increase | On the shelf |
|---|---|---|---|
| E = 0 | Completely inelastic | Volumes unchanged, revenue up 10% | A borderline case, almost never observed |
| |E| < 1 | Inelastic | Volumes down by less than 10 percent, revenue up | Essential items, long-tail items, impulse purchases |
| |E| = 1 | Unitary | Volumes down 10%, revenue virtually unchanged | Reading level, not a product category |
| |E| > 1 | Elastic | Volumes down by more than 10 percent; revenue down | KVI, Online Product Comparisons, Brands vs. Private Label |
| E > 0 | Positive elasticity | Volumes on the Rise | The prestige effect, or more commonly, measurement bias |
Positive price elasticity remains rare. It indicates a prestige effect (the Veblen effect), in which a high price enhances the product's appeal, or, more often, a measurement bias.
The threshold of 1 refers to revenue, not margin
This is the confusion we encounter most often. When |E| is greater than 1, a price increase causes revenue to decline. It does not necessarily cause the margin to decline.
Let's go back to the example, with a purchase cost of €7.50. At €10, 1,000 sales generate a profit of €2,500. At €11, 850 sales generate a profit of €2,975: a 19% increase, even though revenue is down 6.5%.
The general rule: a price increase remains profitable on the margin as long as |E| is less than 1 ÷ (Gross margin + increase). With a 25% Gross margin and a 10% increase, the threshold is close to 2.9, not 1.
The smaller the margin, the higher this threshold.
Asymmetry works against declines. With the same 25% Gross margin , a 10% decline preserves the margin in euros only if |E| exceeds 6.7—that is, 67% more volume.
The whole challenge lies in knowing how low to lower a price without eroding your profit margin.
Our position: Classifying a product as “price-elastic” does not mean its price should be lowered. What matters is its role. A price-elastic loss leader protects the brand’s price image, not its own profit margin.
At the Barbotteau Group in the French Caribbean, a single " Markup " was responsible for the entire store prior to the project, and pricing was managed using Excel.
From now on, each product is assigned three optimal prices: the one that maximizes volume, the one that maximizes revenue, and the one that maximizes margin. The category’s role guides the choice, with a segmentation ranging from A to E.
At a Southeast Asian food retail group, a cautious approach involves capping price fluctuations and reviewing results on a weekly basis. A price increase can be reversed if the committee so decides.
Our belief: elasticity is only useful for decision-making once it is linked to the product's role within its category.
Booper Team, pricing projects conducted in mass retail, garden centers, and multi-brand chains
Other types of elasticity: cross-elasticity, return elasticity, supply elasticity
This guide discusses the direct price elasticity of demand. Three other measures share the same name but address different questions.
Cross-Elasticity Explained in 1 Minute
Read the video transcript
You lower the price of pasta... and right next to it, the price of tomato sauce skyrockets!
A price that boosts sales of another product?
Here's what cross-elasticity is: how sales of one product respond to the price of another. Price elasticity, on the other hand, applies to only a single product.
It's all in the sign. Positive: substitutes.
A more expensive beer? The one next to it sells better.
Negative: side dishes, such as pasta and sauce. Close to zero: no connection.
The price of a beer drops from one euro ninety-nine to one euro sixty-nine. Sales skyrocket by thirty-five percent!
But two similar brands are down 12 and 18 percent.
Department results: sales up 3 percent, margin down 8 percent! The promotion mainly shifted sales around.
The trap? Thinking it's symmetrical.
A price increase for the major brand drives customers toward the store brand. Does the opposite happen?
Much less!
With Booper, the AI analyzes these product relationships and simulates sales and profit margins for the entire department before each promotion.
Cross-price elasticity: Within a given department, a price never changes on its own. Keep this in mind!
Cross-Price Elasticity
It measures the effect of one product's price on the sales of another. The effect is positive between substitutes—such as a national brand and its store brand—and negative between complements—such as a barbecue and its charcoal.
On the store floor, it’s this product that shows how a promotion affects nearby items. It has itsown feature:cross-elasticity.
Tempered Elasticity
It relates changes in demand to changes in household income. While this relationship is positive for most goods, it is negative for so-called inferior goods, which are purchased less frequently as income rises.
For a retailer, this is reflected in product line decisions: when purchasing power tightens, a portion of purchases shifts toward the lowest-priced items and private-label brands, even though the price tags haven't changed.
Price Elasticity of Supply
It measures how the quantity produced responds to a change in price. While the response is small in the short term—a crop does not double in a single season—it increases over the long term.
It primarily affects suppliers. For a distributor, it explains why a spike in prices isn't immediately reflected in purchase rates.
Factors That Affect Price Elasticity in Retail
Product Category, Brand, and Function
Essential goods are inelastic: people won't give up bread just to save a few cents. A national brand facing competition from a store brand is more elastic.
KVI (Key Value Items)—products whose prices customers know—are where price sensitivity is most concentrated: they are what shape the perception of price. The long tail is more tolerant of price fluctuations because no one remembers them.
Channel, Competition, Inventory, and Season
Online, comparing prices takes two seconds: price flexibility is greater there than in stores, where the immediacy of the purchase makes up for a slight price difference.
The same product changes in price sensitivity when a competitor lowers its price, when inventory runs low, or depending on the time of year: a toy is less price-elastic in December than in March.
Budget Allocation and Timeframe
The more a purchase affects the budget, the more people compare prices: a few cents on a yogurt go unnoticed, but 10% on a TV is noticeable.
Time is also a factor. In the short term, the customer faces a price increase; in the medium term, they find a substitute or switch to another brand. Elasticity measured over a two-week period often underestimates the actual response.
Product, store, or cluster: At what level should it be measured?
When measured as a national average, price elasticity obscures the key point. The same product does not behave the same way in a store surrounded by discount retailers as it does in a store with no nearby competitors.
Going to the store provides data that is too noisy to make a decision. The most useful level is often the cluster: stores grouped by local competition, customer base, and format, not by administrative geography.
Our belief is that once there are more than about eight clusters, the complexity outweighs the gain in accuracy for a pricing team. And a cluster is never set in stone: the opening of a competitor’s store is enough to cause a group’s store to change.
Measuring Elasticity Reliably
There are four approaches: the before-and-after comparison, which is the simplest but least reliable; the control group of stores, the standard method in brick-and-mortar retail; A/B testing in e-commerce; and statistical models based on large data sets.
Of more than 1,000 e-commerce price tests analyzed, a price different from the one initially displayed proved to be more effective in 54% of cases: relying on intuition alone leads to lost profit margins.
(Harvard Business Review, March 2024, data from Intelligems)
Elasticity calculated based on a single price change is merely anecdotal, not a meaningful measure. We prefer an honest range to a precise figure that won't hold up to the next price movement.
A useful counterintuitive insight: a product whose price has never changed has no measurable price elasticity in its historical data. For such a product, it’s necessary to conduct tests or rely on comparable products rather than try to come up with a formula from scratch.
Biases That Distort Measurements
Stockouts. A product that’s out of stock on the shelf won’t sell, regardless of its price. While these periods cannot be ruled out, the analysis concludes that sales are extremely sensitive when the issue is solely one of inventory.
Sales, coupons, and giveaways. The price paid is no longer the listed price. An overlooked discount makes it seem like the price is lower than it actually is.
The season and merchandising. A prominent display or a heat wave can boost sales regardless of the price tag. Raising the price at the same time makes it appear as though price elasticity is zero.
Competition and substitution. A decline in volume may be due to a competitor, which is why it’s important to trackthe price index. And if the customer switches to a similar product, the volume remains within the category.
This last point also applies to the product lineup: a product that seems to offer no added value should be price-tested before being discontinued.
Finally find out which products are really driving the profit margin.
While organizing the product assortment, the team noticed that a small number of items accounted for the bulk of sales and profit. Before discontinuing a product, they first test a price reduction and monitor the impact on sales.
- Issue
- An overwhelmingly large selection, with no clear understanding of how each item contributes.
- What Has Changed
- Price segmentation also helps reduce the product assortment and tied-up inventory.
the targeted cash flow, from 20,000 to 12,000 items (ongoing goal).
Recommended reading:Pricing in Garden Centers
Pricing Management · Garden Center Chain, Antilles. Case study written by Booper based on a real client project; client identity has been anonymized.
Using Flexibility to Make Decisions
Adjusting a price. For products that are not very price-sensitive and do not play a role in brand image, price elasticity indicates the extent to which a price increase remains profitable—in other words, where the optimal price for the margin lies. This is tested in a few stores before being rolled out more widely.
Each price change is measured against a control group.
The new prices were first rolled out in a few pilot stores and compared to control stores. The results are reviewed weekly and supplemented by an in-store price perception survey.
- Issue
- Move away from a robust but manual method using Excel across multiple retail chains.
- What Has Changed
- Pilot program with a control group, benchmark indices, and capped price fluctuations.
customers surveyed in-store to gauge their perception of the pilot's price.
Read more:Simulating Your Pricing Strategy
Pricing Department · Food Retail Group. Case study written by Booper based on an actual client project; the client has been anonymized.
Choosing your KVI. The most flexible and best-selling products are candidates for the role of price-leading items. Their prices are adjusted based on market conditions, and margins are made up elsewhere.
Creating profitable promotions. Promotional elasticity indicates whether the additional volume will offset the discount, after accounting for the share simply taken from comparable products.
Time the markdown carefully. A cluster with low price elasticity and a loyal customer base can afford to wait longer to mark down prices and apply smaller discounts. A cluster facing competition needs to plan markdowns in advance to avoid ending up with unsold inventory.
Before changing a price in the ERP system, the adjustment goes through several checks. An error involving a flagship product costs both profit margin and brand reputation.
Measure
Elasticity is estimated based on historical sales data, out-of-stock events, and rejected promotions.
Segment by role
Each category has a specific role (traffic, revenue, margin) that determines the price set.
Simulate
The new price is simulated based on sales, margin, and inventory before any decision is made.
Conduct a pilot test
The price is being tested in a few pilot stores, compared to control stores.
Expand
The award is granted once the weekly reading confirms the expected effect.
Source: A trend observed among Booper customers (Barbotteau Group, a food distribution group in Southeast Asia).
The specifics of each step depend on your catalog and your data: this is the subject of a price diagnostic. For large-scale measurements, see also the elasticity calculated by the AI, product by product.
In summary
Price elasticity indicates how your customers react to a price. It does not, on its own, determine what price to set: the threshold that matters depends on your margin, and the decision depends on the product's role.
When measured accurately, at the right level, and then tested in pilot stores, it becomes a margin driver rather than just a number on a dashboard.
Move from calculation to pricing decisions
Calculating elasticity is one thing; using it to sort through thousands of product listings is another. Let's see how to automate this process.
See also: price adjustment, price modeling.
See also in this feature
- Cross-elasticity, cannibalization, halo effect: the comprehensive method
- Price Elasticity in the Agri-Food Sector: Quantifying a Price Increase Before Negotiating
- Testing Your Prices Without Losing Customers: The Complete Step-by-Step Guide
- Measuring Price Elasticity in Your Catalog: Excel, a Data Team, or a Tool?
FAQ
This is the percentage change in sales volume when the price changes by 1%. It is usually negative and measures customers' sensitivity to a product's price.
At -1.5, a 1% increase results in a loss of about 1.5% in volume. At -0.3, almost nothing.
Divide the percentage change in the quantity sold by the percentage change in price. A product whose price rises from 10 to 11 euros (+10%) and whose sales fall from 1,000 to 850 (-15%) has an elasticity of -1.5.
The figure is reliable only when comparing comparable periods, excluding discontinuations and promotions. Details are provided in the section on reliably measuring elasticity.
Demand is elastic when quantities vary more than price (|E| greater than 1) and inelastic when quantities vary less (|E| less than 1).
This threshold of 1 applies to revenue. For the margin, the threshold is higher: approximately 1 ÷ (Gross margin + increase), or nearly 2.9 for a 25% Gross margin and a 10% increase.
There are four types: direct price elasticity of demand (the most commonly used in pricing), cross-price elasticity between two products, income elasticity, and price elasticity of supply.
In retail, the first two are enough for most decisions: setting a price and measuring the impact of a promotion on comparable products.
Yes, but that's rare. A higher price can increase the appeal of a luxury product: that's the Veblen effect.
In practice, a positive elasticity most often indicates a measurement bias—for example, a rise that coincided with a promotional campaign or a peak season.
There isn't one in absolute terms. Low price elasticity allows for some leeway, while high price elasticity is sought after for a promotion or used to protect a product's price image.
The correct interpretation depends on the product's role within its category: traffic, revenue, or margin.
No. Promotional elasticity is almost always stronger, because it combines the effects of price, urgency, and prominence.
According to IFOP (July 2023), 60% of French people consider promotions to be a decisive factor in choosing a grocery store. The two elasticities are therefore calculated separately.
Measure it excluding promotions and out-of-stock items, at the level you choose (often the store cluster), and then link each result to the product's role.
A price-elastic loss leader protects itself, while a product with low price sensitivity and no brand-building role can withstand a price increase. Finally, test the effect in a few pilot stores before rolling it out.
Exclude periods of disruption, compare one week to the same week of the previous year, and account for promotions and events that boost demand.
Without this cleanup, a break is mistaken for extreme sensitivity, and a gondola endcap is mistaken for a lack of sensitivity.
KVI products are the most price-elastic among the top-selling items: these are the ones customers use to judge your pricing. Their prices are set in response to the competition.
The margin sacrificed on these products is recouped on less sensitive items. It's an investment in our brand image, not a profit center.
Once the number of data points exceeds a few dozen, the spreadsheet can no longer keep up: you have to clean up the biases, measure elasticity by store or by cluster of stores, and then link that data to decisions on pricing, promotions, and markdowns.
To evaluate a solution, check three points: granularity (national, cluster, store), the distinction between base elasticity and promotional elasticity, and the ability to explain each coefficient.
BOOPER calculates price elasticities by product and by store cluster, then submits its recommendations for your review and approval. Revionics, Competera, and Yieldigo also work on price elasticity in retail.

Measuring price elasticity for a catalog does not involve any complex calculations. The challenge lies in isolating promotions, out-of-stock situations, and cross-product effects, and then keeping track of thousands of elasticity values and linking them to margin.
Excel is enough to understand how the mechanism works for a few products. A data team builds good models but struggles to scale them. A dedicated solution covers the entire catalog on an ongoing basis, provided it proves its value using your own data.

A manufacturer that raises its list price does not set the price on the shelf. Between the negotiated list price and the displayed price lie the retailer, its markup, and its promotions. What is measured is the price elasticity of each product, retailer by retailer, at the regular price excluding promotions.
The same product does not have the same price flexibility from one retailer to another, because each retailer assigns it a different role. The same price increase can also result in very different price increases on the shelf, depending on whether the retailer maintains its “ Gross margin ” or its margin in euros.

A price reduction applies to all existing sales, not just new sales. The additional volume must offset this discount granted to everyone, and the threshold to be reached rises even faster when the “ Gross margin ” is low.
A price reduction is structurally more expensive than a price increase: at a 25% Gross margin, a 10% price reduction requires an elasticity of 6.7, whereas a 10% price increase requires only 2.9. Most price reductions are therefore justified by pricing strategy or inventory considerations and should be treated as an investment.