
Price Elasticity and AI: robust models
.avif)
Key takeaway: AI-powered pricing overcomes Excel’s limitations by incorporating complex variables such as inventory and competition to model price elasticity accurately.
This robust management approach safeguards margins and volumes while remaining transparent to managers. Key point: An elasticity exceeding 3.5 often indicates a data anomaly rather than actual customer behavior.
Does your retail AI price elasticity still rely on outdated Excel spreadsheets that ignore stockouts and cannibalization effects?
This guide details the methodology for building robust and actionable models capable of processing millions of diverse signals to optimize every price point in real time according to your specific margin objectives.
By harnessing the power of machine learning, you’ll discover how to protect your flagship products from the competition while identifying hidden growth opportunities to transform your manual pricing process into an automated, high-performing, and foolproof decision-making system.

Why combine price elasticity and AI (and what it truly delivers)
After years of manual pricing on Excel, the advent of AI is radically transforming the landscape for retailers.
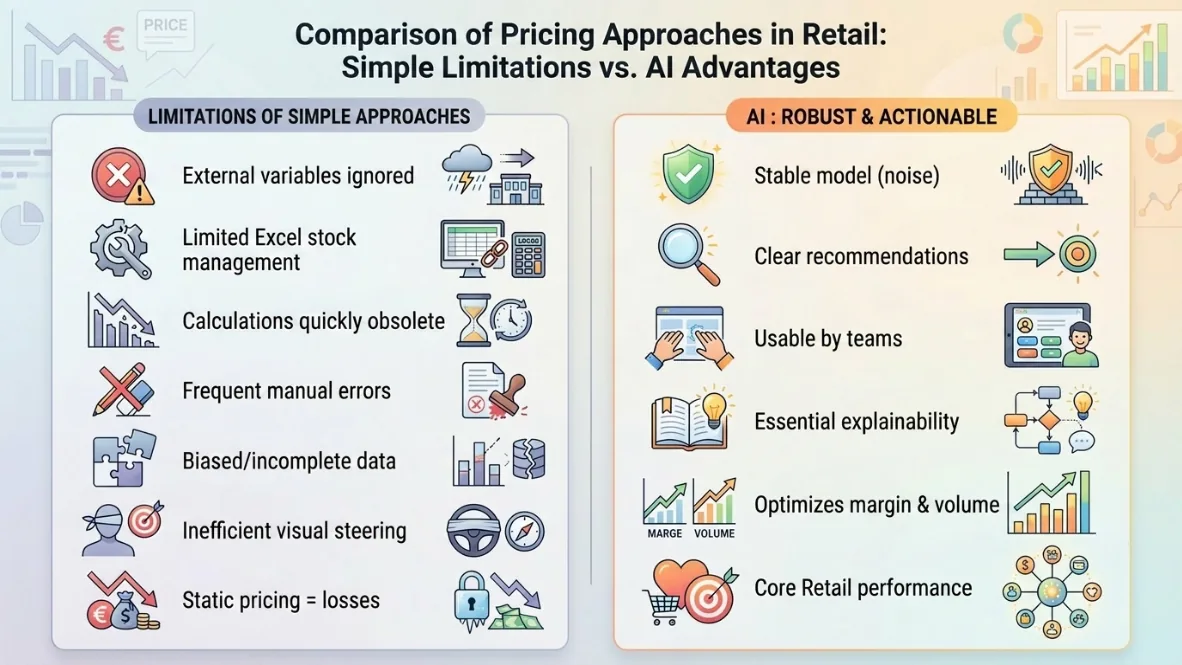
The limitations of basic approaches (before/after, Excel)
Traditional methods too often overlook external variables. Excel handles stockouts extremely poorly. Your calculations quickly become obsolete in a fast-moving market.
The risk of manual errors is constant. Consequently, your decisions are based on biased or incomplete data.
However, flying blind no longer works. Static pricing results in daily revenue losses.
What "robust" and "actionnable" mean in retail
Robustness ensures a stable model despite ambient market noise. Actionability delivers clear recommendations. Forget pure theory. Business teams must be able to use it immediately to make decisions.
Explainability remains critical to reassure managers. If the output is unclear, no one will adopt it.
Connect these concepts to your margin and volume objectives. This is the core of modern retail performance.
This is the margin gain observed by McKinsey among retailers that deployed data-driven dynamic pricing, alongside a 2% to 5% sales growth (McKinsey study, "Using big data to make better pricing decisions").
Retail pitfalls that skew elasticity (to address before modeling)
However, before launching the algorithm, you must clean the data, as retail datasets are inherently "dirty".
Out of Stock & Availability
A stockout completely distorts demand perception. If a product is out of stock, sales drop independently of the price. The model must identify these gaps.
Excluding these days from the analysis prevents major biases. This is a non-negotiable data cleansing step for your pricing algorithm.
Actual availability is a key signal. Without it, price elasticity is inaccurate and useless.
This is the average out-of-stock rate observed in global retail: about 8 out of 100 customer-requested products are missing on shelves, compared to 3% to 4% for top-performing retailers (IHL Group study, "Fixing Inventory Distortion", 2025-2026).
Promotions, coupons, bundles (effective price)
The listed price is not always what the customer pays. Loyalty discounts and coupons alter perception. You must calculate the true net price now.
Bundles also create volume distortions. The model must isolate the pure promotional effect to remain consistent and reliable.
Always use the average effective price. It is the only reliable data point for decision-making.
Seasonality, events, weather (where applicable)
The demand for sunscreen skyrockets in sunny weather, regardless of the price. Events like Christmas artificially boost certain categories. AI must accurately incorporate these exogenous factors.
Seasonality is noise that must be neutralized; otherwise, weather-driven effects are incorrectly attributed to pricing.
The calendar is your best ally. Anticipate consumption peaks starting today.
Assortment mix & merchandising changes
A layout change drastically alters a product's visibility. If the assortment changes, sales shifts are inevitable. These movements invisibly disrupt historical data.
Merchandising influences purchases just as much as the price tag. You must flag these changes to the model to avoid calculation errors.
Catalog stability is rare. Handle these historical disruptions with high rigor.
Cannibalization & substitutions
Lowering a product's price can kill a neighboring item's sales. This is the classic cannibalization effect. Cross-price elasticity must be closely monitored by your teams.
Substitute products react together to variations. Never analyze an item in isolation, or you risk significant losses.
Think in terms of categories. Overall margin is the ultimate goal of your strategy.
Competition & price positioning
Your price elasticity depends directly on the prices charged by your competitors. If your competitor lowers their prices, your demand falls. The relative price index is a key variable in your calculations.
KVI positioning imposes competitiveness constraints. You cannot adjust these prices without thorough external analysis.
Monitor the market continuously. AI thrives on competitive data to learn quickly.
Essential data (and how to ensure its reliability)
To inform these strategies, input data quality is the ultimate limiting factor in any AI project.
Net price vs. displayed price: building the "effective price"
The effective price is total revenue divided by sales volume. It incorporates all immediate or deferred point-of-sale discounts. This serves as the calculation baseline for true elasticity.
Avoid using theoretical list prices. They do not reflect actual customer basket realities.
Cleanse anomalous transactions. A price of zero is clearly a data entry error.
Inventory / stockouts: exclusion rules or correction
Create availability indicators broken down by store and day. If inventory falls below a critical threshold, exclude the data. This prevents underestimating true elasticity.
Volumes can also be corrected via extrapolation, but data exclusion is often technically much more robust.
The "in stock" signal is critical. Ensure the reliability of your logistics pipelines before running any calculations.
Temporal alignment (day/week) + catalog quality
Pricing and sales data must be perfectly synchronized. Even a one-day offset ruins the correlation. See the issue? Also, verify SKU consistency.
Weekly aggregation sometimes over-smooths demand signals. Favor daily granularity if your systems support it.
In short, a clean catalog simplifies everything. Data preparation always requires significant time.
Competitor product matching (if monitoring)
Matching your products against competitor offerings is challenging. Descriptions often vary significantly between retailers. Leverage matching algorithms to automate this tedious task. A matching error severely distorts your relative price index.
Focus initially on your most price-sensitive products. Your KVIs warrant flawless manual matching.
Verify these attributes to ensure the quality of your competitive intelligence data:
- EAN/GTIN
- Brand
- Description
- Volume/Capacity
- Unit price
Building an AI elasticity model: a clear methodology (without overcomplication)
Once the data is clean, you can finally move on to building the AI pricing engine to power your retail AI price elasticity strategy.
Step 1: Segmentation (category, KVI, channel, store)
Do not treat milk like a television. Segment your products by strategic role and sales channel. Purchasing behaviors differ significantly between web and brick-and-mortar stores.
KVIs require surgical precision. Core assortment items tolerate a higher degree of approximation in daily pricing calculations.
Segmentation prevents reliance on generic models. Be specific to finally achieve precision.
Step 2: Useful retail features (relative price, promotional depth, calendar, etc.)
Features are the input variables for the model. Include the price gap with the market leader. Also integrate the current promotional type for greater accuracy.
The day of the week is crucial in retail. Saturday sales have nothing in common with Monday sales.
The more expressive the feature, the better. AI thrives on rich and varied contexts.
Step 3: Choose a model family (simple → advanced)
Start with a regularized regression for its simplicity. If the data is massive, switch to gradient boosting. These models effectively handle complex and varied non-linear relationships.
Avoid total black boxes initially. Understanding the model is the absolute priority for your teams.
Test multiple approaches in parallel. AI is an iterative and continuous process.
Step 4: Validation (temporal backtesting + business metrics)
Backtesting consists of testing the model on historical data. Compare predictions with actual observed sales. Use metrics like MAPE or RMSE to evaluate performance.
However, do not overlook business indicators. Generated margin is the ultimate judge of your profitability.
An accurate model is not always profitable. Validate the actual and concrete financial impact.
Step 5: Explainability (reason codes) & guardrails
Each recommendation must be justified by a reason code. Why is the model suggesting this price increase? Is it due to low elasticity or competition? Without an explanation, business teams will refuse to apply the product scores.
Implement guardrails to prevent absurd prices. AI must never exceed the boundaries set by management.
Trust is earned through transparency. Explain the "why" before the "how much" to convince your colleagues.
Making the model actionable: from score to pricing decision
The model is ready, but it is useless if it does not drive concrete actions in the field.
"Safe" price hike recommendations (margin growth without volume loss)
Identify products with very low elasticity. A moderate price increase will not impact sales volumes. This is the fastest lever to boost margin.
Proceed in small, successive steps. Monitor customer reactions in real time to make adjustments.
Safety first. Do not compromise your brand's price image.
This is the average impact on operating profit of a mere 1% price increase at constant volume: McKinsey's historical demonstration (Marn & Rosiello, “The Power of Pricing”) regarding the leverage effect of targeted pricing.
KVI Protection & Price Corridors
Key Value Items (KVIs) must remain highly competitive. Define strict price corridors relative to the competition. The model must never propose going outside these boundaries.
This is a matter of brand strategy. AI respects your pre-established business rules without exception.
Automate out-of-bounds alerts. Stay proactive on basic items.
Promotional optimization (depth / mechanics / targeting)
AI helps determine the optimal discount. There is no need to offer 50% off if 30% off generates the same uplift. Test different mechanics, such as buy-one-get-one-free.

Targeting helps prevent subsidizing already acquired customers. Maximize the return on every euro invested in your campaigns.
Promotions must be profitable. Measure the actual incremental revenue generated.
Inventory-driven markdown (end-of-season)
Manage end-of-lifecycle products based on inventory levels. If sell-through is too slow, AI suggests a progressive markdown. The objective is to clear shelves prior to the new collection launch.
Avoid massive last-minute sales. Instead, rely on reductions driven by actual demand.
Preserve your residual margin. Inventory represents dormant capital.
Omnichannel: Maintaining coherence under constraints
Prices may vary between online and physical stores. However, excessive discrepancies generate customer frustration. AI must balance local optimization with global consistency. Logistics constraints also influence these pricing decisions.
Here are the key metrics to monitor for your pricing decisions:
- Online price
- In-store price
- Delivery cost
- Local inventory
- Omnichannel margin
Harmonize your channels for a seamless customer experience. Pricing serves as a global lever for your brand.
Governance & deployment (essential for scalability)
For your AI retail price elasticity strategy to succeed, it must be supported by a robust governance framework.
Validation workflows + audit logs
No price should change without human validation. Implement a streamlined approval workflow for your managers. Maintain a detailed audit trail of every pricing decision.
Ultimate accountability remains human. AI proposes scenarios, but the pricing manager always retains final authority.
Traceability ensures operational security. Audit your price modifications on a regular basis.
Recalculation frequency & drift monitoring
Models degrade over time. Recalculate your elasticities weekly to stay aligned with market reality. Monitor data drift to detect shifting consumer behaviors.
Last year's model is frequently inaccurate. The retail sector moves far too quickly to remain static.
Automate calculation updates. Data freshness is critical here.
Anomaly alerting + rollback plan
Set up automated alerts for suspicious fluctuations. If the model suggests a price cut by half, halt immediately. A rollback plan allows you to revert to the previous state.
IT security and your business objectives are interconnected. Do not take unnecessary risks with your margins.
Test your emergency procedures. Prevention is better than cure, especially in pricing.
Table: common biases → symptoms → corrections
Here is a practical summary to identify and remedy your models' issues.
Identify and correct model errors
| Bias | Symptom | AI Solution |
|---|---|---|
| Out of stock | Unobserved demand | Exclusion of out-of-stock periods |
| Aggressive promotions | Suspicious sales spikes | Specific causal uplift |
| Strong seasonality | Cyclical noise | Granular temporal features |
| Cannibalization | Distorted cross-sales | Cross-elasticity matrices |
| Active competition | Unexplained customer churn | Relative price indexing |
| Mix shift | Unstable aggregation | Hierarchical Bayesian models |
This table serves as a survival guide for the data lead, bridging the gap between business and technical teams. Each row addresses a real-world issue encountered in-store. Apply these fixes to stabilize your outcomes.

Do not attempt to solve everything at once. Prioritize the biases affecting your KVI products. Fixing inventory data often yields a higher return than building a complex new model. Maintain a pragmatic approach to your adjustments.
30/60/90-day adoption plan
Avoid transforming everything overnight; instead, follow this progressive roadmap.
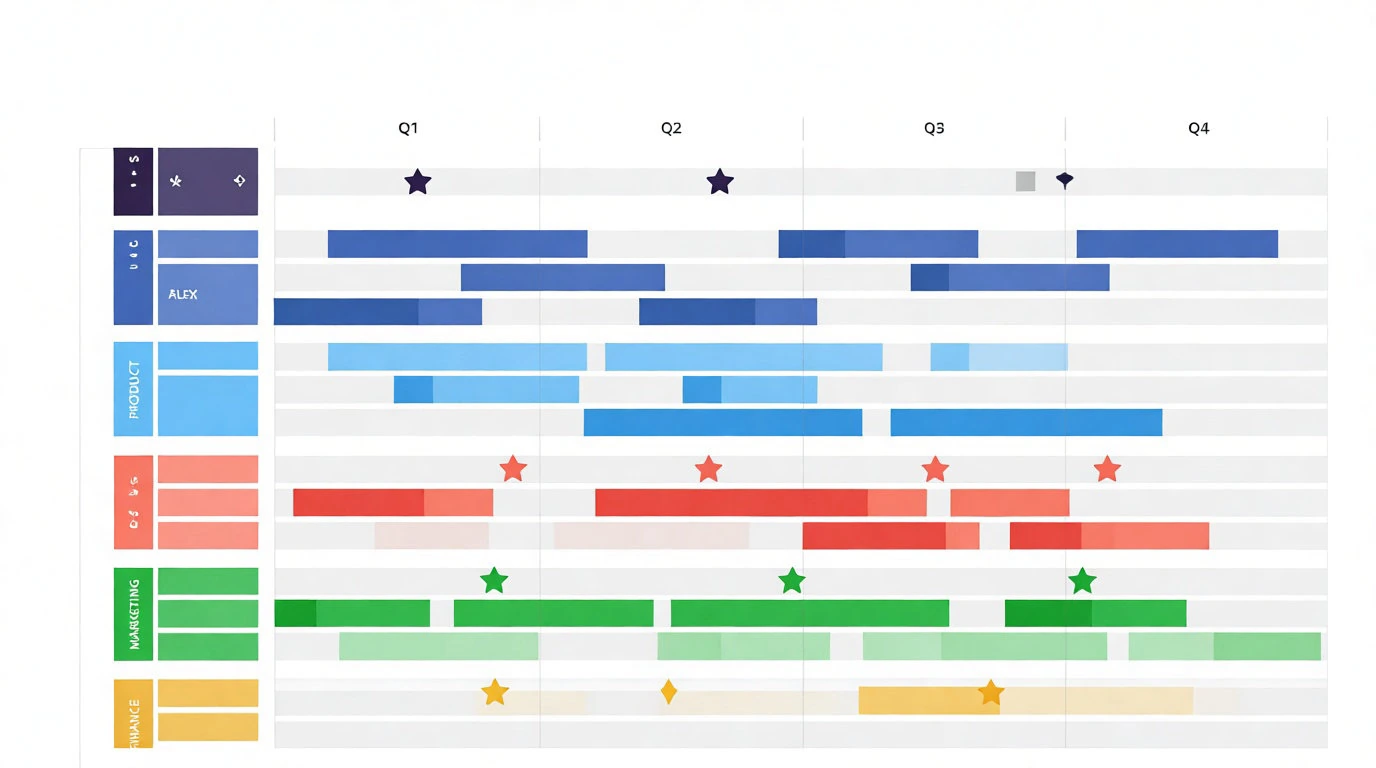
Day 30: Scoping + Data + MVP on 1 category
The first month is dedicated to gathering data for your retail AI price elasticity model. Choose a category with clean historical data and deploy a simple model to validate feasibility.
Identify key internal stakeholders. Success relies on the buy-in of teams and business experts.
Aim for a quick win. The MVP must unequivocally demonstrate real value to all stakeholders.
Day 60: Pilot + KPIs + Guardrails
Expand the test across multiple representative categories. Define the success metrics you will closely monitor and implement initial automated guardrails to secure pricing.
Train pricing managers on score interpretation. The tool should become their daily assistant for better decision-making.
Measure the performance gap against the legacy system and swiftly make necessary adjustments.
90: industrialization + training + continuous improvement
Deploy the solution across your entire assortment, connect data pipelines, and enable model recalculation. Establish a steering committee to drive continuous improvement.
Document all processes to ensure long-term viability. Continuous training must be provided for new team members.
Celebrate margin gains. AI is now your commercial performance standard.
Checklist: Are you ready for an elasticity + AI model?
Before getting started, verify that your foundations are robust enough to support the architecture.
Data / Processes / Integrations / Governance
To begin, gather these critical components. Your foundation must be flawless; without these pillars, the algorithm will yield poor results. Here are the essential elements:
- 2 years of sales history
- Daily inventory data feed
- Reliable competitive intelligence data
- Business validation workflow
- Price deployment tool
This list serves as the baseline foundation for success. If even a single element is missing, your project risks stalling. Take the time to thoroughly check off every requirement.
The organizational aspect remains the most challenging hurdle. Ensure that management actively supports the initiative. A validated checklist drastically reduces your risk of failure.
Good AI model = more confident decisions + streamlined processes
Ultimately, AI does not replace the pricing manager; it empowers them with advanced capabilities.
Adopting AI-driven price elasticity in retail transforms pricing from a cost center into a growth driver. Decisions become objective and rooted in real data. Rather than reacting to market fluctuations, you anticipate them. This is a major paradigm shift.
Process mastery guarantees operational peace of mind. Massive pricing errors become a thing of the past. Teams can focus on strategy rather than execution.

Start your transformation today with a simple step. The technology is mature and the benefits are immediate. The future of agentic retail pricing belongs to those who master their elasticity.
Trust your data. It holds critical insights regarding your customers.
Mastering price elasticity with AI in retail requires reliable data and explainable models to turn your pricing strategy into a growth engine. Deploy a pilot now to secure your margins and anticipate market fluctuations. The future of commerce belongs to decision-makers who leverage their data today.
FAQ
Still have doubts? Here are the answers to the industry's most frequently asked questions to help clear things up.
Demand forecasting estimates future volumes at a constant price.Price elasticity measures how these volumes change when the price changes. These are two complementary tools for developing a solid pricing strategy.
One predicts, the other simulates. Both are essential for avoiding flying blind and better anticipating the impact of your business decisions.
Use price elasticity to set your prices. Forecasting is primarily useful for planning inventory, procurement, and operational needs.
For a retailer, confusing the two is like driving blind: a forecasting model alone says nothing about the effect of a price change, while an elasticity model alone is not enough to determine inventory levels. Combined with the business safeguards described above, these two building blocks form the foundation of robust price management.
Gradient Boosting models such as XGBoost and LightGBM are widely used in retail. They effectively capture the nonlinearities and complex interactions between price, promotions, seasonality, and competition.
Hierarchical models can also be very useful for low-volume categories or fragmented assortments. The right choice always depends on the quality and structure of your data.
Start by testing simple approaches to establish a baseline for comparison.Explainability must remain a key criterion to ensure that the model deployed is not too opaque for the business teams.
This is the same approach described in the model-building method above: start with a regularized regression before moving on to gradient boosting if the data warrants it, rather than aiming right away for the most sophisticated black-box model available on the market.
Promotional variables must be incorporated as full-fledged features in your models. They have a significant impact on demand and cannot be treated as mere statistical noise.
Use cross-elasticity matrices to measure volume shifts between SKUs. Your model should analyze the category as a whole, not each product individually.
Don't think in silos. Cannibalization is a reality on the ground that must be quickly assessed to improve the performance of the overall shopping cart, not just that of a single item.
In practice, ignoring this effect amounts to underestimating the actual impact of a price reduction: the margin gained on one product may be partially offset by lost sales of its closest substitute, which skews the profitability calculation if you look at only one product at a time.
It is necessary to precisely identify periods of disruption using inventory data and stock reports. These periods must be flagged or excluded to prevent the AI from interpreting them as the market rejecting the price.
Zero sales does not necessarily mean zero demand. This distinction is fundamental for building a robust model and preventing major calculation bias.
Clean up your historical data thoroughly. In pricing, data quality is more important than the sheer volume of data collected.
This is one of the pitfalls described earlier in this article—and often the most costly one: a model that learns from demand distorted by unreported stockouts will produce inconsistent price recommendations, particularly for SKUs with irregular availability.
Methods such as SHAP make it possible to break down each prediction and identify the variables that had the greatest influence on the final recommendation. This helps make AI decisions more transparent to business teams.
A simple chart or a few well-formulated reason codes are often enough to build trust. Transparency fosters buy-in and accelerates the adoption of new pricing tools .
Don't hide the logic behind the numbers. The more understandable the model is, the more widely it will be accepted within the organization.
This requirement is directly linked to Step 5 of the method described above: without a reason code associated with each recommendation, pricing teams refuse to apply the product scores, regardless of the statistical accuracy of the underlying model.
A weekly frequency works well for most retailers. It allows them to identify recent trends without overreacting to day-to-day noise or insignificant micro-variations.
However, the optimal frequency depends on your market’s volatility, competitive pressure, and your brand’s promotional schedule. Real-time updates aren’t always useful, especially if your pricing strategy requires stability.
Automate the calculation pipeline to avoid heavy manual interventions and reduce data entry errors. Consistency is often more valuable than extreme frequency.
It’s the same principle as the drift monitoring discussed in the governance section of this article: recalculating too infrequently risks ending up with an outdated model, while recalculating too often risks mistaking noise for a signal—with the same ultimate risk: poorly calibrated prices.
Focus on tracking changes in gross margin, sales volume, and the relative price index compared to your direct competitors. These metrics provide a clear picture of the impact of your pricing strategy.
The rate at which recommendations are accepted is also very important. It helps measure whether your teams trust the analyses generated by the system.
Also keep an eye on the overall price-volume profile and incremental profitability. The real goal is not just to adjust prices, but to sustainably improve sales performance.
As a point of reference, McKinsey reports margin gains of 5 to 10% among retailers that have implemented data-driven pricing, along with 2 to 5% sales growth: it is these orders of magnitude that should guide your KPI goals, not an arbitrary target.
Start with a product family that has a solid history of data. Avoid categories that are too seasonal or too volatile for your first test, so you can obtain clearer signals.
A limited scope allows for faster iteration, reduces risks, and enables learning without jeopardizing the brand’s overall performance. This is often the best way to quickly demonstrate the project’s value.
Don't strive for perfection right from the start. The most important thing is to build a credible initial use case, then gradually expand the system based on feedback from the field.
This is exactly the logic behind the 30/60/90-day adoption plan described above: scoping and MVP for a specific category in the first month, an expanded pilot with KPIs and safeguards in the second, and full-scale rollout only in the third—never the other way around.
For specific examples, see " agent-based pricing: definition and examples."
To learn more about this method, check out our guide to calculating price elasticity using data or our comprehensive definition of price elasticity. To implement these models in your product catalog, explore our price optimization software.

The model is the easy part. A recommendation engine can be up and running in a few months; what takes years is the knowledge base, competitive matching, the rule set, explainability, and compliance. According to Exclaimer (2025), 71% of in-house development projects are abandoned, and 83% in regulated industries: the breaking point is almost never deployment—it’s maintenance.
The hidden cost is a cost of continuity: an in-house tool relies on two or three people, and if they leave, the asset becomes a liability. The build remains useful within a narrow and stable scope, as a complement to a solution rather than a replacement for it. The deciding factor isn’t the team’s expertise; it’s their ability to last ten years.

Data and context are two distinct assets: data describes what happened, while context explains what we are allowed to do and what would be absurd. This context is implicit by nature: it has never been written down because there was never a need to do so as long as decisions were made by humans who shared it.
Four categories cover the essentials: price benchmarks, relational constraints, unwritten rules, and commercial objectives by category. Formalizing them provides lasting value, because the context outlasts the models: algorithms are replaced every two or three years, but a written context remains a company asset.

A business case for a pricing solution combines two types of return on investment that are completely different. Friction ROI refers to the hours saved: easy to measure, but capped. Decision ROI refers to the margin points gained from better-set prices: difficult to measure, and unlimited.
Confusing the two explains the gap identified by IBM in 2025: 66% of executives report productivity gains from AI, but only about one in five has met their return on investment (ROI) goals. The ROI of a decision isn’t measured by comparing “before” and “after,” but rather against a control group; otherwise, seasonal factors, inflation, or a competitor’s actions will be credited to the tool. The test to apply to a business case: if you remove all the “time saved” lines, is the project still profitable?