
AI-Powered Sales Forecasting: method and KPIs
.avif)
AI transforms sales forecasting by precisely separating baseline demand from promotional uplift. This granular SKU-by-store analysis enables real-time inventory adjustments and margin optimization. A key finding: the use of predictive analytics can reduce spoilage of perishable goods by up to 15 percent.
The goal of BOOPER’s AI-powered Sales Forecasting module is to implement this SKU-level granularity by store: to guide scenarios and drive growth without compromising price competitiveness.
A major restaurant chain has reduced its waste of perishable goods by 15% by refining its forecasts. However, many retailers still struggle with incomplete sales data or stockouts that skew their demand models. Data that is misinterpreted today invariably translates into lost profit margins tomorrow.
This article explains how AI-powered retail sales forecasting transforms your transactional data into drivers of growth. Together, we’ll break down the methods for isolating promotional uplift, the essential accuracy KPIs, and the action plan for scaling your predictive models.

Retail sales forecasting: what is it all about?
AI-powered sales forecasting relies on analyzing massive historical data and weak signals to anticipate SKU demand per store. It distinguishes between baseline and promotional uplift, ensuring adjusted inventory and optimized margins to meet future demand.
To move from theory to practice, let’s start by laying the groundwork for what a forecast actually is today.
Simple definition: forecast = estimating future demand
A forecast is a rigorous mathematical estimate. It projects your future sales by cross-referencing historical transaction data with relevant external variables.
It is, above all, a decision-making tool. It does not predict the future with certainty, but it does calculate a reliable statistical probability.
The goal remains practical. We plan to adjust our inventory levels with precision.
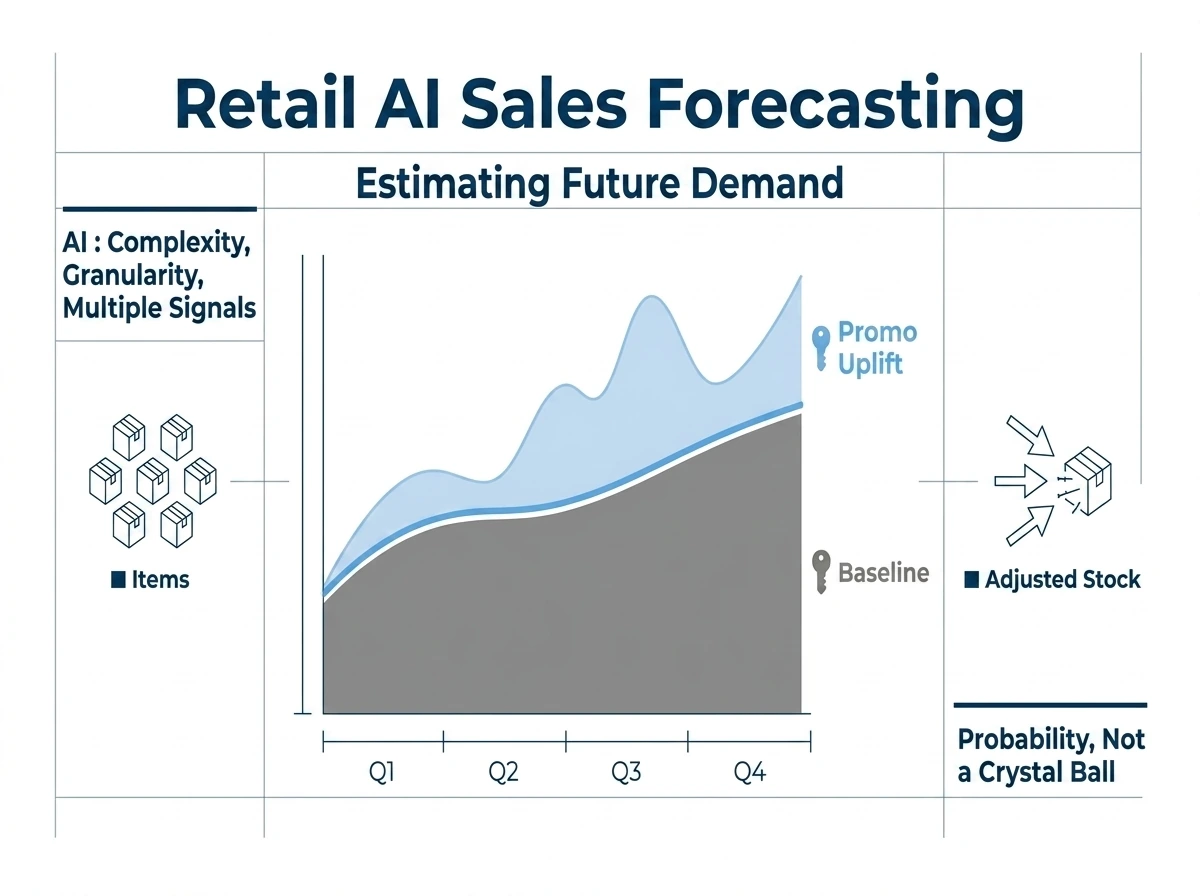
Baseline vs. promotion (uplift): 2 different forecasts
The baseline represents your products' natural sales. It reflects the typical sales volume observed in stores or online without any specific marketing efforts.
"Uplift" refers to the increase in volume. It represents the additional sales generated by a promotion or a specific event.
Why AI is useful (complexity, granularity, multiple signals)
AI processes thousands of data points simultaneously where humans would become overwhelmed. It detects local patterns and continuously learns from each piece of data. Traditional models quickly reach their limits when faced with such vast amounts of information.
Its strength lies in its high level of detail. We now analyze each item by retail location on a daily basis to anticipate trends with surgical precision.
AI-driven forecasting reduces forecasting error by 20 to 50 percent and cuts out-of-stock situations and lost sales by up to 65 percent (McKinsey, 2022).
The Essential Data (and the Errors That Skew Everything)
But for the algorithm to be effective, it needs to be fed the right data, because poor-quality data will ruin the forecast.
Sales history + granularity (day/week, SKU/store)
The foundation remains your own transaction history. You need at least two years of data. This allows you to capture recurring seasonal cycles.
The schedule needs to be detailed. Planning on a weekly basis is often too vague for fresh produce.
The SKU-store pair is the basic unit. That’s where accuracy comes into play.
Net price, special offers, bundles (actual price)
The listed price isn't always the price you pay. You need to factor in the net price after discounts and coupons. The AI must understand the actual price elasticity.
Bundles and packages alter behavior. They create a windfall effect that must be isolated.
Inventory, availability, stockouts (the #1 pitfall)
A zero sale does not mean there is no demand. If the product was out of stock, demand may have been high. Ignoring past stockouts leads to underestimating future demand. This is the most common mistake in retail.
We need to "boost" sales during periods of stockouts. We generate a theoretical demand for the algorithm.
Without this adjustment, the model will self-correct. Your inventory levels will then continue to decline indefinitely.
Out-of-stock situations cost French hypermarkets and supermarkets nearly 5 billion euros in lost sales each year (NielsenIQ, LSA Barometer, 2022).
Product catalog + attributes (variants)
For new products, AI uses attributes. Color, material, or style serve as points of comparison. This is known as analogy-based prediction.
This allows you to launch a collection without its own history. The model searches for "cousins" in the previous database.
Calendar, seasonality, events
Movable holidays like Easter shift peak periods. The school calendar also has a massive impact on traffic. These variables are essential "features" for the model.
A long weekend in May changes everything. AI handles these shifts naturally.
Seasonality isn't just about the weather. It's primarily a social rhythm.
Optional: weather, traffic, competition
The weather has the greatest impact on the textile and food industries. A sunny weekend boosts barbecue sales. These are external factors with a significant impact.
Foot traffic or competitors' prices help fine-tune the forecast. That's the icing on the cake.
An 8-step method for creating an actionable forecast
Once the data is ready, a rigorous protocol must be followed to turn these figures into concrete decisions on the ground.
1) Define the business objective (inventory, promotions, pricing)
We don't make forecasts just for the sake of it. The goal might be to reduce excess inventory. Or it might be to ensure that a display unit is available.
Each goal requires a different setup. Precision takes precedence over responsiveness.
Make your priorities clear from the start. This is the foundation of the project.
2) Select the level of detail (SKU/store/day vs. week)
For inventory planning, daily data is essential. For a seasonal purchasing plan, monthly data is often sufficient. The data must be aligned with the decision-making cycle.
The more sophisticated it is, the more complex it becomes. But that’s where AI really adds value.
3) Clean the data (outliers, data gaps, actual prices)
Remove one-time, non-recurring sales. A massive B2B order in-store skews the trend. This is known as "outlier" cleaning.
Correct any incorrect prices or data entry errors. Signal quality depends directly on this.
A clean model learns faster. Never skip this step.
4) Distinguish between baseline and promotional
Quantify the impact of each factor. What percentage of sales comes from the crossed-out price? What percentage comes from in-store placement?
This allows you to simulate future promotions. You'll then be able to predict the impact of a 30% discount.
The baseline becomes your health indicator. It shows organic demand.
5) Add useful explanatory variables (features)
This is where we incorporate domain expertise. Add catalog release dates or opening dates for nearby competitors. These "features" help the AI understand shifts in trends. Without them, the model remains blind to sudden changes.
Test the impact of each variable. Keep only those that actually improve the score. Too much unnecessary data creates noise.
6) Validate using backtesting
Ask the model to predict past data. Hide last month’s sales figures from it and compare the results. That’s the only way to verify its true reliability.
If the discrepancy is too large, adjust the parameters. This validates the algorithm's robustness.
This is the essential crash test. We don't roll anything out without proof.
7) Turn into decisions (scenarios, thresholds, alerts)
A forecast is just a number. It should trigger an automatic order or an alert. Set confidence thresholds to automate the process.
Create "best-case" and "worst-case" scenarios. This helps manage the risk of disruption. It also ensures that decision-makers remain in control of critical situations.
The tool should serve people. It frees up time for analysis.
8) Monitor drift + recalibrate
The world is changing, and models become outdated. Purchasing behaviors evolve in the wake of a crisis or a shift in trends. Monitor how accuracy drifts over time.
Regularly recalibrate the AI with fresh data. A model that stops learning quickly becomes a liability. Agility is the key to success.
To take your revenue optimization to the next level, discover our solutions for Pricing Optimization Software and Promotion Management. ia retail sales forecasting is just the first step toward a data-driven sales strategy. If you notice slow-moving inventory, our Markdown & Clearance module will help you streamline your inventory using sales forecasts.
Use Cases and KPIs
| Use case | Required data | Target KPI |
|---|---|---|
| Promotion Planning | Price history + uplift | Gross Margin / MAPE |
| Reduction in stockouts | Inventory + POS Transactions | Service rate |
| Markdown formatting | Product lifecycle | Inventory turnover |
Model Bias and Corrections
| Bias identified | Symptom | Correction |
|---|---|---|
| Excessive optimism | Recurring excess inventory | Adjust the forecast bias |
| Seasonal amnesia | Breakout on expected peaks | Integrate calendar features |
| Data drift | Declining accuracy | Retraining on new data |
Checklist: Before Believing a Forecast
- Have past stockouts been restated?
- Has the impact of weather or strikes been isolated?
- Has the model been backtested over the past three months?
- Is the confidence interval displayed?
30/60/90-day deployment plan
- Day 30: Data analysis and initial cleaning (outliers).
- Day 60: Pilot program for a product category and validation of backtesting.
- Day 90: Industrial deployment and automation of inventory alerts.
Real-world use cases (retail & e-commerce)
AI no longer merely predicts; it helpsprevent costly strategic mistakes through highly targeted applications.
1) Plan a promotion (sales uplift + quantities)
Accurately calculate the inventory you'll need for your next flyer. AI estimates the uplift based on past results from similar campaigns. This way, you can avoid disappointing your customers.
No more guesswork when it comes to orders. We rely on solid probabilities.
Make the most of the end of the sale. Avoid being stuck with unsold inventory.
2) Reduce stockouts and excess inventory
This is the most immediate benefit. By aligning safety stock levels with actual demand, you free up cash. Less capital sits idle in your warehouses. Product turnover automatically increases across the board.
AI detects signs of stockouts before they happen. It suggests emergency restocking. Customer satisfaction soars.
3) Manage end-of-season markdown
When should prices be lowered to clear the shelves? AI simulates sales velocity based on the discount rate. It finds the balance between clearing inventory quickly and maintaining profit margins. That’s the art of smart markdown.
Don’t sell off your inventory too early if demand remains strong. Conversely, don’t wait until the product becomes obsolete. The timing has to be precise.
The French food distribution sector alone generates 633,000 metric tons of food waste per year, a volume that can be reduced through careful management of inventory and markdowns (ADEME, Study on Food Losses and Waste, 2024).
4) Improve pricing (elasticity + relative price)
Price is the number one driver of profit. AI analyzes price elasticity for each item. It suggests price increases where demand is inelastic. It protects your sales volume for highly sensitive loss leaders.
Incorporate competitors' prices in real time. The model adjusts your recommendations to ensure they remain competitive. This is a dynamic and profitable pricing strategy foroptimizing store performance.
5) Multi-store/zone allocation
Send the right product to the right place. A shoe model might be a huge hit in Paris but fail to gain traction in Lyon. AI optimizes the initial allocation of inventory. It reduces costly inter-store transfers.
Take into account the specific local conditions of each area. Weather and regional events dictate the needs. Allocation becomes a major competitive advantage.
KPIs: How to Measure the Quality of a Forecast (Without the Jargon)
To determine whether your models are performing well, you need to look beyond simple sales figures and use accuracy metrics.
Mean Absolute Percentage Error (MAPE/MAE explained simply)
MAPE measures the average percentage error. If your MAPE is 10%, you were correct 90% of the time. It is the easiest metric to communicate internally. It provides a clear picture of overall reliability.
The MAE, on the other hand, calculates the error in physical units. It is useful for understanding the impact on actual inventory. These two metrics complement each other for management purposes.
Bias (over/under-estimation)
Does your model tend to be overly optimistic? A consistent positive bias leads to unnecessary excess inventory. Conversely, a negative bias causes you to miss out on sales. The goal is to have a bias close to zero over time.
Determine whether there is systematic bias in certain categories. This often reveals a lack of explanatory data. Correcting this bias is a priority for profitability.
Stockout rate / excess inventory / service level
They are the frontline arbiters. The service rate measures the percentage of requests fulfilled immediately. It is the favorite KPI of store managers.
A good forecast should reduce stockouts while keeping inventory levels low.
That’s the perfect balance to aim for. AI makes this feat easier.
Business KPIs: margin, revenue, satisfaction, costs
Ultimately, profitability is what matters most. Better forecasting boosts your revenue by improving product availability. It also reduces logistics costs associated with urgent orders. Customer satisfaction improves because the product is in stock.
Track the evolution of your gross margin after deployment. Fewer markdowns mean higher net profit. This is where the ROI of AI becomes tangible thanks toimproved retail margin.
Table: Use case → Required data → KPIs to track
Here is a visual overview to help you align your business objectives with data and key performance indicators.
Summary of Applications and Measures
This table summarizes the key components of your predictive strategy. It helps ensure you don’t miss the mark. Each use case has its own data requirements.
| Use case | Key Data | Key Performance Indicator | Business benefit |
|---|---|---|---|
| Special Offer | Promotion history, schedule, net price | Uplift / MAPE | Campaign ROI |
| Restock | Real-time inventory, supplier lead times | Service rate | Zero stockouts on the shelves |
| Markdown | Local sales, slow-moving inventory | Gross Margin | Optimal clearance of end-of-season inventory |
| Pricing | Price elasticity, competition | Revenue | Dynamic pricing |
| Allowance | Sales by region, product attributes | Inventory turnover | Multi-site inventory balancing |
Choosing your first project often depends on the quality of your data. But one thing is certain: without a solid data history, the algorithm won’t work miracles. For AI-powered retail sales forecasting, start with restocking or promotions, where the margin gains are most immediate.
Biases & Pitfalls (and How to Correct Them)
Even the best algorithm can falter if certain subtle mechanisms of retail are overlooked.
Out-of-stock items, changes to the product lineup, isolated promotions
As we’ve seen, discontinuations mask actual demand. Similarly, abruptly changing the product mix disrupts the models. If you don’t flag a past promotion, the AI will interpret it as an organic increase. These events must be documented for the model.
Use "flags" in your databases. This helps the algorithm distinguish between different cases. Data transparency is your best ally.
Cannibalization & substitution
A promotion for Brand A often causes sales of Brand B to drop. This is knownas the cannibalization effect. AI needs to analyze the category as a whole, not just the product.
If product X is out of stock, the customer buys Y. This is known as substitution.
These interconnected systems are essential. They prevent overall overstocking.
“Drift”: When the Model Grows Old
"Data drift" occurs when reality diverges from the training data. Your customers' preferences or purchasing channels change. As a result, the model loses its effectiveness.
Schedule a quarterly review of your algorithms. This is essential maintenance to stay on top of things.
A forecast is never set in stone. It evolves with your business.
30/60/90-Day Action Plan (and Expected ROI)
Don’t try to change everything overnight; take a gradual, proven approach.
30: data audit + MVP for 1 category
Start by taking stock of your data. Is it accessible and clean? Choose a single product category for your test. This is your Minimum Viable Product (MVP). The goal is to quickly demonstrate value without taking any risks.
Identify critical gaps, such as a history of stockouts. Lay the technical groundwork for your future tool. This phase is the learning phase.
60: pilot + dashboards + process
Roll out the pilot program in a few stores or a web-based area. Create simple dashboards for business teams. Integrate forecasting into existing ordering processes. The tool needs to be used in practice every day.
Gather user feedback in the field. Refine the usability and clarity of the recommendations. We’re shifting our focus from the technical aspects to the business side.
90: industrialization + training + continuous improvement
Roll out the solution across your entire catalog. Train inventory managers and buyers on the new tools. Implement automated accuracy monitoring. AI then becomes the driving force for your supply chain.
Celebrate your first gains in margin and time. Start planning the model’s next iterations now. The process of continuous improvement is now underway.
Checklist: Before Believing a Forecast
Before confirming a bulk order generated by an algorithm, run it through this security filter.
10 checkpoints
Always keep a critical eye on the system. A forecast that’s too perfect is often suspicious. Check the fundamentals before committing financially.
- Is the history clean?
- Have the shortages been resolved?
- Has the promotion been identified?
- Is the calendar up to date?
- Is bias acceptable?
- Was the weather included?
- Do the new products have any equivalents?
- Is the confidence level displayed?
- Are outliers excluded?
- market trend
By following these steps, you can avoid the common pitfalls of AI-driven retail sales forecasting. Unprocessed raw data will always result in an inaccurate forecast. Relying on AI never replaces the need for business validation.
Conclusion: Take it to the next level
Sales forecasting is no longer a tedious administrative task but a strategic driver of growth.
AI turns your supply chain into a competitive advantage. It safeguards your margins and delights your customers. Don’t let chance dictate your inventory levels anymore. The technology is ready—all that’s missing is your initiative.
Start small, but start now. The productivity gains are massive and immediate. Your teams will focus on the exceptional rather than the routine. This is the future of smart retail.
Ready to turn your data into profits? Explore our solutions for automating your forecasts. Contact us for a personalized analysis of your data.
Mastering AI-powered sales forecasting in retail safeguards your margins and eliminates stockouts. By incorporating historical data and early warning signs, you can turn your data into an immediate driver of growth. Adopt this predictive approach today to dominate your market. The future of retail belongs to the bold who are driven by data.
From Forecasting to On-the-Ground Action
A good MAPE is useless if it doesn't trigger an order. Let's see how to link your forecasts to your replenishment process.
FAQ
AI-powered sales forecasting involves using machine learning algorithms to estimate future demand by SKU and by store, by cross-referencing massive amounts of historical transaction data with weak signals such as weather, competitor prices, or the calendar. Unlike traditional methods, it does not simply extrapolate the past in a linear fashion.
The article quantifies the benefits of this approach: according to McKinsey (2022), an AI-driven forecast reducesforecasting error by 20 to 50 percent and cuts out-of-stock situations and lost sales by up to 65 percent compared to traditional methods.
The goal remains the same: to adjust inventory levels accurately, not to generate a number for the sake of forecasting, as detailed in our guide on sales forecasting methods and best practices. It is a decision-support tool that calculates a reliable statistical probability—never an absolute certainty.
The baseline represents a product's natural sales—the usual sales volume observed without any specific marketing intervention—and serves as an indicator of the product's organic performance.Uplift, on the other hand, refers to the additional sales volume generated specifically by a promotion or sales event.
The article presents Step 4 of its 8-point method as the point at which these two components are mathematically isolated: what portion of sales comes from the strikethrough price, and what portion comes from in-store placement. This separation then makes it possible to simulate the impact of a future promotion—such as a 30% discount—based on proven promotional pricing strategies, without skewing the interpretation of long-term organic demand.
Confusing the two throws off the entire forecasting process: a forecast that does not distinguish between baseline and uplift overestimates baseline demand for shelf stock after each campaign, which leads to excess inventory once the promotion ends.
According to the article, the minimum requirement is at least two years of sales and price history at the SKU-store level—a requirement detailed in our article on the sales history needed for accurate forecasting —to capture recurring seasonal cycles. Weekly forecasting is often too vague for fresh produce, which requires daily granularity.
It is also important to include the net price after discounts and coupons rather than the listed price, as well as inventory and availability data to identify out-of-stock situations. The calendar, movable holidays, and seasonality round out this foundation as essential “features,” before adding optional external data such as weather, traffic, or competitors’ prices.
The financial implications of this rigorous data collection are clear: stockouts cost French hypermarkets and supermarkets nearly 5 billion euros in lost sales each year, according to NielsenIQ (LSA Barometer, 2022)—a loss of revenue that incomplete data can only exacerbate.
This is a critical point identified in the article: a zero sale does not mean there is no demand. If the product was out of stock, the AI must “correct” the data by recreating a theoretical demand rather than interpreting that zero as a genuine sign of customer disinterest.
Without this correction, the model engages in self-censorship: it learns that the product isn’t selling, recommends an even lower reorder quantity, which leads to further stockouts—a vicious cycle of stockouts and poor sales forecasting that the article identifies as the most common mistake in retail. Ignoring historical stockouts thus leads to systematically underestimating the product’s future potential.
This correction ties into the broader issue of waste raised in the article: according to ADEME (2024), the French food distribution sector alone generates 633,000 metric tons of waste per year, and careful inventory management directly helps reduce this volume by preventing both stockouts and poorly anticipated overstocks.
The frequency depends directly on the business decision cycle, the article explains. For the food sector or fresh produce, a daily recalculation is essential for managing restocking; for textiles or home goods, a weekly update is generally sufficient.
Agility remains key, beyond a simple fixed schedule: AI must be able to react immediately to an unforeseen external event—such as unexpected weather or a supply chain disruption—to adjust order recommendations without waiting for the next recalculation cycle.
This requirement aligns with the eighth step of the method described in the article—drift monitoring: purchasing behaviors change after a crisis or a shift in trends, and the article recommends a quarterly review of the algorithms to ensure that the model does not quietly drift away from real-world conditions.
According to the article, the primary metric is MAPE (Mean Absolute Percentage Error), which measures the average percentage error: a MAPE of 10% means that the forecast is accurate 90% of the time—a metric that is easy to communicate internally. The MAE, which complements MAPE, calculates the error in physical units and helps illustrate the actual impact on inventory.
It is also important to monitor the model's bias: a constant positive bias leads to recurring overstock, while a negative bias results in lost sales; the goal is to keep it close to zero over time rather than letting it drift in one direction or the other.
Beyond these technical metrics, the article reminds us that, ultimately, it is the business KPIs that matter—just as with the key indicators for pricing management: service levels, gross margin, and revenue. Better forecasting must result in fewer markdowns and higher net profit; otherwise, statistical accuracy remains a theoretical exercise disconnected from profitability.
According to the article, a forecast is only valuable if it triggers a decision: it must be linked to order management tools to automate restocking, or generate alerts for inventory managers regarding critical situations that require human judgment.
This is the seventh step in the 8-point method outlined in the article: defining alert thresholds and validation workflows to automate certain decisions, and developing “optimistic” and “pessimistic” scenarios that help manage the risk of disruption while allowing decision-makers to retain control over the most sensitive cases.
By making data actionable in this way, the article highlights the organizational benefit: teams are freed from repetitive order-entry tasks so they can focus on analyzing exceptions and developing sales strategies, with the tool supporting people rather than replacing them.
The article recommends that the best approach is to start with an MVP (Minimum Viable Product) focused on a single product category or a limited geographic area, rather than aiming for immediate scaling across the entire catalog. This allows you to validate the quality of the available data and quickly demonstrate a return on investment—an approach similar to our method for rolling out a pricing tool—without disrupting the entire company.
This is the first phase of the 30/60/90-day deployment plan detailed in the article: at Day 30, data audit and initial removal of outliers; at Day 60, pilot implementation with dashboards and integration into existing business processes; at Day 90, full-scale rollout with team training and automation of precision monitoring.
Once the pilot has demonstrated measurable gains in profit margin or a reduction in scrap, the article recommends a phased rollout rather than a "big bang" approach—the goal being to learn from this initial, limited scope and adjust the models before a full-scale rollout across the entire network.

Goal-based pricing starts with the target outcome (margin, revenue, category competitiveness) and lets AI calculate the prices needed to achieve it, rather than piling on rules one product at a time.
The engine simulates thousands of scenarios by factoring in business constraints, purchasing behavior, and product cannibalization; if the objective is unattainable, it identifies the best compromise.
For retailers supported by Booper: +0.5 to +3 percentage points of margin in a few months and -70 to -90% reduction in price preparation time . The pricing manager retains the final decision.

The key takeaway: An AI-generated price recommendation without an explanation falls on deaf ears with pricing teams, who refuse to apply a score they don't understand.
Explainability and auditability are two distinct requirements: the former justifies a recommendation at the time it is proposed, while the latter makes it possible to trace who approved what, when, and why—even several months later. A key finding: Explainability is identified as a key AI risk by a large majority of executives, but very few organizations are actually taking steps to address it.

Fixed-rule dynamic pricing is giving way to autonomous AI agents that make decisions in real time—on both the seller and buyer sides—without waiting for a human approval cycle.
90% of B2B purchases will be handled by purchasing agents by 2028 (Gartner), and 47% of the retail sector has already adopted agent-based AI (NVIDIA): competition between agents is becoming the norm, not the exception.
The real risk is not speed but the lack of safeguards: price floors, price ceilings, and explicit governance are becoming the priority, lest algorithmic collusion—which regulators are already scrutinizing—occur.