
Pricing KPIs: Build Your Retail Dashboard

Effective pricing management relies on a constant balance between margin, competitiveness, and price perception. By monitoring five categories of key performance indicators, you can safeguard your profitability while remaining attractive to customers. A mere 1% increase in price realization can boost operating profit by 6.4%, transforming your pricing strategy into a major driver of growth. Building and equipping this KPI dashboard is the purpose of BOOPER’s Price Diagnostic module.
A 1% improvement in your price realization can increase your operating profit by 6.4% (median figure measured by Revology Analytics across 2,000 companies). In a retail market where every cent counts, raw data is your best ally for turning your prices into drivers of immediate growth.
However, managing your business based solely on revenue is like driving in a fog without realizing your margin is evaporating. This article breaks down the key pricing KPI categories essential for building an effective decision-making dashboard and safeguarding your profitability, complete with formulas, monitoring frequencies, and alert thresholds. For a simple definition of a pricing indicator, see the “Pricing KPI” entry in the glossary.

Why Pricing KPIs Are Essential (and Why “Just One KPI” Isn’t Enough)
Pricing management relies on a dashboard of five key performance indicators: margin, competitiveness, price image , execution, and promotions. According to an analysis by Revology Analytics of 2,000 companies, a 1% improvement in pricing execution translates into a median increase of 6.4% in operating profit . Therefore, every poorly managed pricing point is costly.
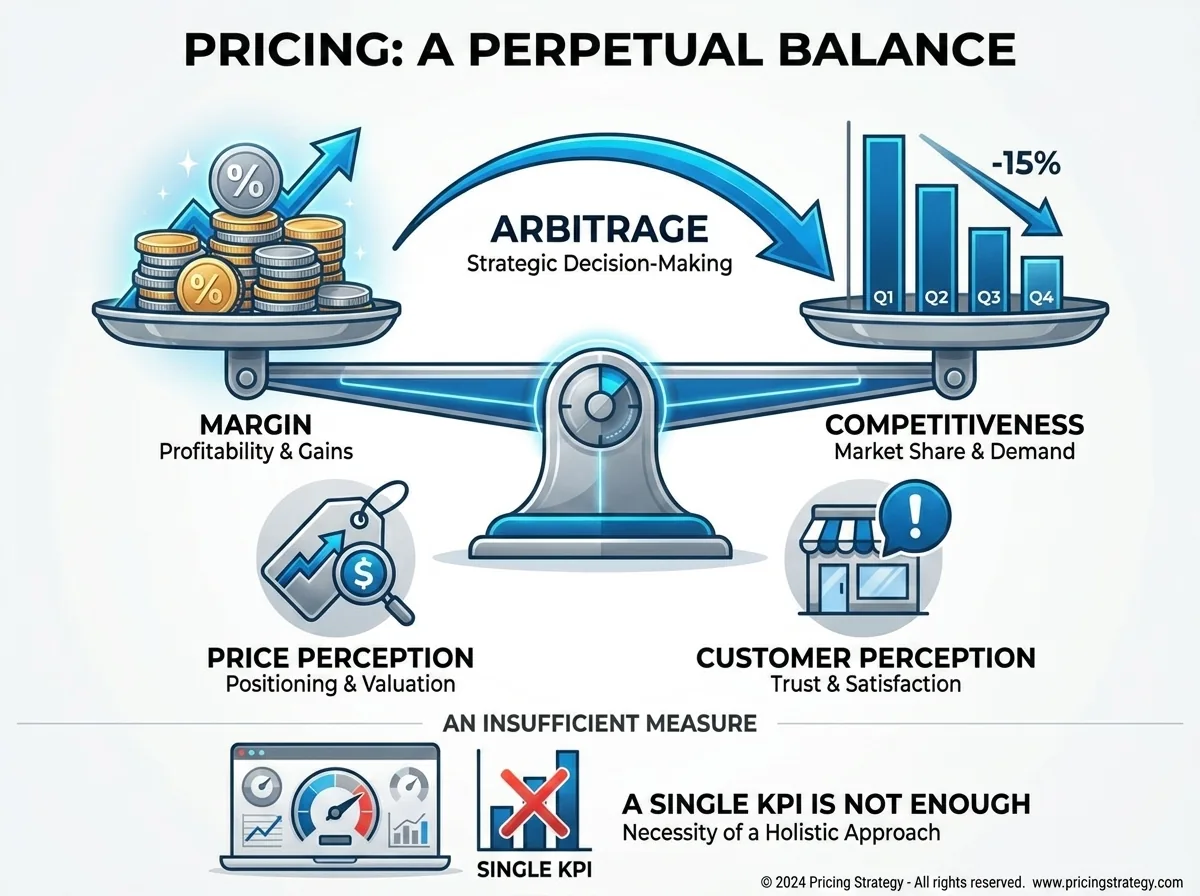
Thinking that a single number can sum up your business health is a risky bet. In reality, the key lies in striking a balance between these conflicting forces.
Pricing = margin arbitrage / competitiveness / price-image
Setting a price is not a one-time decision. It involves constantly striking a balance between protecting profit margins and remaining competitive in the face of aggressive retail competitors.
Price perception also comes into play. Setting the price too high for a flagship product (KVI) undermines the customer's overall perception.
Management therefore requires a 360° perspective, in which each metric is interpreted in light of the others.
Common mistakes: managing based on financial statements or intuition
Many retailers focus solely on revenue. This is a dangerous trap. It's possible to sell a lot while still losing money on every transaction.
A gut feeling about the “right price” is never a substitute for data. Without precise pricing KPIs, decisions become purely emotional and risky.
Operating blindly often leads to unnecessary price wars, in which profitability always suffers.
The 5 categories of pricing KPIs (the dashboard)
To avoid these pitfalls, you need to structure your dashboard around complementary pillars that cover the entire product lifecycle.
Profit Margin KPIs
This category measures the financial health of your sales. It includes gross margin and contribution margin.
- Gross Margin
- Net margin
- Discount rate granted
Competitiveness KPIs (competition)
Here, we look at how your prices compare to the market. The price index is the key tool. It allows us to determine whether you are perceived as expensive or affordable.
We track the average gap to the leaders. This helps us adjust our positioning.
Price-image KPIs (KVI + consistency)
The price image is based on the items that customers compare most often (KVI). It is important to ensure price consistency across different sizes or product lines to avoid losing customers.
An illogical price erodes trust. Price sensitivity varies greatly depending on the product category.
Performance KPIs (quality and reliability)
A strategy is nothing without flawless execution. This pillar identifies labeling errors or delays in updating prices. It ensures that the price displayed is correct.
Common errors ruin the customer experience. They also skew your overall performance analytics.
Promotions & Markdown KPIs (Actual ROI)
Sales and promotions have a significant impact on profitability. It is important to measure the increase in sales volume they generate. Did the discount really create additional value for the retailer?
Poor management can lead to impact of unstructured discounts on your bottom line.
Margin KPIs: Driving Profitability Without Sacrificing Volume
Let’s take a closer look at the first pillar—the one that ensures every sale actually contributes to your profits.
Gross margin (% and €) + mix effect
Gross margin remains the key indicator. It should be monitored both in absolute terms and as a percentage. Be mindful of the mix effect, which can mask declines in profitability.
If you sell more low-margin products, your overall profit will drop—even if your revenue is growing.
Always analyze margins by category. This reveals the true drivers of growth.
Net Margin and Contribution Margin
The contribution margin includes variable costs such as logistics. In e-commerce, this is essential for determining whether a shipment is profitable. Never overlook these hidden costs when making your calculations.
If the price is too low, delivery can result in a loss. This is a major risk in the marketplace.
Average price / average basket size (by channel)
The average basket size indicates whether your cross-selling strategies are working. In-store, the goal is often to increase the number of items purchased per customer. The average price per item complements this approach.
A price increase can lead to a decline in sales volume. But it can also increase the total purchase amount.
Competitiveness KPIs: Measuring Market Position vs. Competitors
Once you've secured your profit margin, you need to make sure your prices aren't driving customers away to the competition.
Price Index (Overall and KVI)
The price index compares your pricing to a base of 100. If your index is 105, you are 5% more expensive than the market. This is a fundamental pricing indicator.
Focus this metric on your best-selling products. That’s where the competition is fiercest.
An overall index can mask disparities. Break it down by product category.
Some French people have already compared prices before making a purchase, and 9 out of 10 do so always or often (E.Leclerc Observatory / Ipsos, May 2023).
Average Price Difference and Dispersion
The average gap shows the actual price difference in euros compared to your competitors. The spread, on the other hand, indicates whether your prices are consistent or all over the place. Avoid large, unjustified gaps.
Too much scattered messaging dilutes your brand message. Stay true to your brand promise.
Competitive Coverage and Matching Reliability
You can't compare everything. The coverage rate indicates what percentage of your offering is "matched" by the competition. A 70% rate is often a good target.
Accurate product matching is crucial. Comparing different products can completely skew your decisions and your margins.
Automate this monitoring process using tools. Manual tracking is too slow.
Price-Image KPIs: Managing Customer Perception
Beyond the raw numbers, pricing is a matter of psychology and the overall perception of the brand.
KVI Index + KVI “in-zone” share
KVI (Key Value Items) are products whose prices are memorized by customers. You must be flawless when it comes to these items. Being "on target" means staying within an acceptable price range.
Losing out on the KVI products ruins your price image—even if the rest of the catalog is very competitive.
Identify your key products (often a few hundred SKUs) and monitor them as a priority.
Product line consistency (price tiers, psychological price points)
Price points should be logical. A family-size package should be cheaper per pound than a smaller one. Also, use price endings like .99 or .95, as they reassure shoppers.
An inconsistency in the product range causes confusion. As a result, customers end up not buying anything.
Omnichannel price discrepancies (store vs. web vs. marketplace)
Customers are everywhere. They don’t understand why a product costs more in-store than on your website. Managing these price discrepancies helps prevent frustration and complaints at the register.
Consistency strengthens the brand. It also simplifies inventory and returns management.
Performance KPIs: Avoiding Mistakes That Undermines Management
Even the best strategy will fail if it isn't implemented properly on the ground or on-site.
Rate of price outliers
"Outliers" are abnormal prices, often caused by data entry errors. A product listed at €1 instead of €100 can end up costing a lot. Check for these anomalies daily to minimize the damage.
Set up automatic alerts. This allows you to make adjustments before the first sale.
Surveys show a discrepancy between the price displayed on the shelf and the price paid at the register, a rate that has remained stable in recent years (DGCCRF, ministerial response, January 2023).
Channel Labeling and Synchronization Error Rates
In-store, the price tag must match the price at the register. Frequent discrepancies erode customer trust and can result in legal penalties. Price synchronization across channels must be nearly instantaneous.
Conduct regular shelf audits. This is the only way to verify the actual situation on the ground.
Price Update Schedule
How long does it take to respond to a competitor's price drop? In e-commerce, every hour counts. If your response time is too long, you’ll lose sales and visibility on price comparison sites.
Agility is a competitive advantage. It enables companies to meet demand at the right time.
Competitive False Matching Rate
If your tool compares a 6-pack to a single item, your decisions will be inaccurate. Monitor the quality of the data provided by your suppliers. Poor matching leads to unjustified price reductions.
Clean up your internal and external pricing databases regularly. Accuracy is more important than quantity.
KPI for Promotions and Markdowns: Measuring True ROI
Promotions are powerful tools, but they can also destroy value if not managed properly.
Uplift (volume gain) vs. cannibalization
Uplift measures the increase in sales during the promotion. But be careful of cannibalization: if you sell fewer products at full price, the actual gain may be zero or negative.
Analyze customer behavior. Are they buying only because it's on sale?
The goal is toattract new customers. No discounts for regulars.
Promotional ROI (incremental margin)
The key promotional KPI calculates the additional profit generated after paying the discount. It is the ultimate metric for validating a sales campaign. Don’t just look at sales volume.
A successful promotion must cover its own costs. It must also generate a net profit.
Promotional campaigns result in losses for manufacturers in France because they fail to track actual ROI (NielsenIQ, “Trade Promotion Performance” study, 2015).
Promotion depth / promotion frequency
Offering too many promotions can get customers used to not paying full price. Be mindful of how often you run promotions so as not to devalue your brand. The size of the discount should remain exceptional.
However, customers' likelihood of switching brands depends heavily on price sensitivity.
Markdown Effectiveness and Sales Rate
Markdowns are used to clear out slow-moving inventory. Their effectiveness is measured by the rate at which the inventory sells out relative to the discount offered. The goal is to make room for new products.
It's better to get a substantial discount early than a small discount too late, because every week of idle inventory incurs carrying costs and takes up space.
Summary Table: Formula, Frequency, and Alert Threshold by KPI
Managing a strategy without specific metrics is like driving in a fog. Here’s a practical guide to help you organize your dashboard and know when to take action if things start to go off track.
| KPI | Formula | Frequency | Alert if... |
|---|---|---|---|
| Price Index | (Average price / Competitor's price) × 100 | Daily | Index > 105 (loss of competitiveness) |
| Gross Margin | COGS – Cost of Goods Sold | Weekly | A 2-point decrease compared to the previous year |
| Defect rate | (Number of pricing errors / Total number of prices) × 100 | Daily | Rate > 1% (reputational risk) |
| ROI Promotion | Incremental margin / Promotional cost | Weekly | Ratio < 1.2 (unprofitable operation) |
| KVI Index | Price Index for “Image” Items | Daily | Index > Top 100 Products |
| Stock Sell-through | (Units sold / Initial inventory) × 100 | Weekly | Sales are too slow vs. forecasts |
This dashboard provides an immediate, actionable overview for management. Monitor these thresholds to protect your margins. A quick response can often prevent lasting damage to your market position.
KPIs by role: Who monitors what?
Not everyone needs the same level of detail. Pricing governance depends on each person's responsibility.
Pricing Manager
He ensures overall consistency. He monitors price indices and execution anomalies on a daily basis. His goal isto optimize the calculation rules to maximize performance.
He also analyzes price performance indicators to adjust the rules, making him the orchestrator of the system.
Category Manager
He focuses on his product line. His priorities are gross margin and product mix. He uses KPIs to negotiate with suppliers and validate his promotions.
He must balance volume and profitability within his department.
Management / Finance
Management wants a big-picture view. It looks at the overall net margin and changes in the brand’s price image. These indicators are used to validate major strategic directions strategicdirections of the company.
They are primarily interested in the bottom line and growth. Pricing is a financial lever.
Set up a pricing KPI dashboard (method)
Building an effective dashboard requires a systematic approach to avoid getting buried under a mountain of useless numbers.
Choosing KPIs (fewer but better)
Don’t try to track everything at once. Start by selecting two metrics from each category. A dashboard that’s too complex will eventually stop being used by operational teams.
Prioritize the KPIs that have the greatest impact on your profit. Simplicity is key.
Define data sources (net price, costs, inventory, competition)
The quality of your dashboard depends on your data. Connect your net price feeds, purchase costs, and inventory in real time. Add price data from your direct competitors.
Accurate data prevents false pricing alerts. This is the foundation of any serious analysis.
Set thresholds/alerts and review procedures
A number without context is useless. Set critical alert thresholds. Establish routines: daily reviews of anomalies, weekly reviews for tactics, and monthly reviews for overall strategy.
Rituals foster a data-driven culture. They force people to make decisions.
Scale up (logs, governance, continuous improvement)
Automate the collection and calculation of your pricing metrics. Keep a record of changes to understand the impact of your past decisions. That’s how you ’ll make progress over the long term.
- Dashboard Checklist: Reliable Sources
- Email alerts
- Price History
Common Mistakes and How to Avoid Them
Even with the best tools, certain common pitfalls can cloud your judgment and lead you to make poor decisions.
Focusing Exclusively on Revenue
This is the most common mistake. Revenue can increase even as margins plummet. Always look at the net profit generated after each sales transaction or price reduction.
Volume isn't everything. Profitability must remain your top priority.
Do not isolate the promotional effect
Promotions artificially boost sales. If you don’t isolate them, your shelf price analyses will be skewed. You may end up believing that a regular price is performing well when it actually isn’t.
Make sure to keep your day-to-day business separate from your promotional activities. This is essential for clarity.
Relying on an ill-matched competition
Comparing apples to oranges is a recipe for disaster. Poor price matching will cause you to lower your prices unnecessarily or miss out on opportunities to raise them. Check your most strategic products manually.
External data is often messy. Take the time to clean it up before taking action.
Neglecting omnichannel consistency
Having different prices online and in-store for no good reason frustrates customers. It also makes it harder for you to assess your performance. Maintain a clear policy to protect your brand image.
Omnichannel retailing requires strict pricing discipline. It calls for high-performance synchronization tools.
Conclusion: Pricing is a data-driven discipline
Setting prices without metrics is like driving in the fog. A well-organized dashboard allows you to react quickly while protecting your profitability. This is a major strategic advantage.
Don’t get stuck in your ways. Continuously test, measure, and adjust your prices. It’s the only way to stay competitive in a rapidly changing retail landscape.
Mastering your pricing KPIs is the only way to strike a balance between margin and competitiveness. By automating the tracking of your price index and promotional profitability, you secure your future profits. Take action now to turn your data into a driver of immediate and sustainable growth.
FAQ
The three fundamental pillars are gross margin, the price index, and the ROI on promotions. Together, they provide a comprehensive view of your profitability, your competitive positioning, and the actual effectiveness of your sales initiatives.
We recommend starting by tracking these three key indicators. You can then expand your dashboard to include more specific metrics, such as price elasticity or product line consistency, as your needs evolve.
These three metrics correspond to three of the five categories detailed in the dashboard in this article: margin, competitiveness, and promotions. The remaining two categories— price-image (see how to manage price-image with the right metrics) and execution—become priorities as soon as your sales volumes or the number of channels you operate increase, because an undetected price anomaly or omnichannel discrepancy can negate the gains achieved through the first three KPIs.
The financial impact is clear: a mere 1% improvement in your rate realization can boost operating profit by 6.4%, which justifies investing time in selecting and rigorously monitoring these metrics rather than focusing solely on revenue.
The calculation is simple: divide your selling price by your competitor’s, then multiply the result by 100. For example, a Price Index of 102 means that your price is 2% higher than the market price or that of your target competitor.
To gain a truly actionable insight, perform this calculation on a basket of comparable products. This provides a much more accurate picture of your overall competitiveness than analyzing a single product.
The summary table in this article recommends monitoring this KPI daily, with an alert triggered if the index exceeds 105—a threshold that indicates a loss of competitiveness that must be addressed before it affects traffic.
Always break down this index by product category, using up-to-date competitive data, rather than relying on a single overall figure: an average index of 100 can mask a severe shortfall in your KPIs and a comfortable margin elsewhere—two realities that call for very different actions.
A KVI (Key Value Item) is a flagship product whose price is remembered by customers and serves as a benchmark for evaluating your store. These are generally best-sellers or high-volume, frequently purchased items.
Your competitiveness on these specific items determines your overall price image. If you’re poorly positioned on your key performance indicators (KPIs), customers will perceive your entire catalog as expensive, even if your other products are very competitive.
This article recommends trackingthe KVI index daily, setting an alert to go off as soon as it exceeds 100 for your flagship products, and focusing on which products to monitor as a priority in light of the competition (around 500 SKUs) rather than trying to monitor the entire catalog with the same level of intensity.
Losing money on KVI items undermines your price image even if the rest of the catalog remains highly competitive, whereas making a profit on those same items gives you room to generate greater profitability on products where customers don’t make immediate comparisons.
Price perception is measured by cross-referencingthe actual price index on the KVI with customer perception surveys, such as the NPS (Net Promoter Score). The goal is to identify the gap between your listed prices and customer perception.
A well-managed pricing strategy is a powerful driver of profitability. It helps reassure customers about comparable products, thereby allowing for higher margins on items that are harder to compare.
Beyond simply calculating your price image, this article emphasizes the importance of product line consistency: logical price tiers across formats, adherence to psychological price points, and omnichannel consistency between stores, the website, and marketplaces. Without these elements, price perception deteriorates even when the overall index remains acceptable.
In practical terms, one statistic underscores the importance of this issue: According to the E.Leclerc/Ipsos Observatory, 98% of French people have already compared prices before making a purchase, which makes perceived consistency at least as important as the listed price alone.
To measure promotional ROI, calculate the incremental margin generated by the increase in volume—also known as uplift—and then subtract the cost of the discount offered and marketing expenses. A campaign is a financial success only if this final result is positive.
Be sure to factor in the additional logistics costs when making your calculations. These hidden costs can sometimes eat up a significant portion of the profits generated by increased sales.
This article, like our 7 proven promotional pricing strategies, also recommends keeping an eye on cannibalization: if the uplift comes at the expense of full-price sales of similar products, the actual gain may be zero or negative despite higher volumes during the promotion.
This tracking is not just a minor detail: according to a NielsenIQ study cited in this article, 58% of promotional campaigns result in losses for manufacturers in France because they fail to track actual ROI—a reminder that sales volume during a promotion never, on its own, guarantees profitability.
Monitoring must be tailored to the nature of the data: price anomalies and competitive trends are analyzed daily. Category performance is monitored weekly, while the overall strategy and benchmark indices are reviewed monthly.
Responsiveness is crucial, especially in e-commerce, where prices fluctuate rapidly. A steady pace allows you to correct discrepancies before they have a significant impact on your financial results.
Properly configuring your pricing alerts and workflows starts with this schedule: the summary table in this article breaks it down by KPI—daily Price Index and anomaly rate, weekly gross margin and promotional ROI—with a specific alert threshold for each, such as an anomaly rate greater than 1% or a promotional ROI ratio lower than 1.2.
This process is accompanied by governance rituals: a daily review of anomalies, a weekly review of tactics, and a monthly review of strategy, as described in the method for setting up a pricing KPI dashboard earlier in this article.
E-commerce focuses primarily on contribution margin and conversion rate. In-store, the emphasis is on average order value (AOV) and reliable order fulfillment, such as consistency between shelf pricing and the price at the register.
Although their operational priorities differ, both channels must share a common understanding of the price index. Data standardization remains the main challenge in developing a consistent pricing strategy across e-commerce and brick-and-mortar stores.
This article points out that the contribution margin includes variable costs such as logistics: a price that is too low can result in a loss on a shipment in e-commerce, a risk that is virtually nonexistent in a physical store, where the cost of service is already absorbed by the retail location.
Unmanaged omnichannel price discrepancies between online and in-store remain the primary risk common to both channels: customers do not understand why the same product is more expensive on one channel than on the other, which erodes trust and makes it difficult to assess overall performance.
Use tools to ensure the accuracy of your competitor product matching, and perform a manual validation for your most strategic products. It is essential to filter out outliers—such as prices from unreliable third-party sellers on marketplaces—that could skew your analyses.
Keeping your databases clean is your best safeguard against poor decisions. Incorrect matching can lead to unjustified price reductions that unnecessarily erode your gross margin.
This article recommends aiming for competition coverage of about 70% of the catalog rather than 100%, prioritizing the accuracy of matching for your strategic SKUs over the comprehensiveness of the entire product range.
The false-matching rate deserves dedicated monitoring just as much as the price anomaly rate: if your tool compares a six-pack to a single unit, the resulting repricing decision will automatically be incorrect, regardless of the quality of the rest of your dashboard.
To frame the initiative, consult our pricing project methodology.

The volume sold during a promotion does not indicate whether it created value: part of it comes from similar products (cannibalization), and another part from purchases that were simply brought forward.
Each promotional scenario must be costed out prior to launch using the same metrics: base sales, actual incremental sales, cannibalization, carryover, halo effect, net margin for the category, and cost per unit actually gained.
Margin-volume arbitrage can then be explained: a stated objective, visible forecasting factors, constraints adhered to, and a documented validation process.

A national food retailer with more than 1,700 stores and several million price points per year: With Booper, its pricing teams simulate the impact of each decision on margins, competitiveness, and price perception before implementing it.

Key takeaway: Pricing, promotions, and markdowns are three factors that constantly influence one another, but are still managed using separate tools at most retailers.
This fragmentation creates inconsistencies that are invisible in the short term (a muddled pricing image, margins eroded by promotions that aren’t properly coordinated with markdowns) but costly in the long term. Gartner has, in fact, formalized this convergence as a distinct market category: unified optimization of pricing, promotions, and markdowns.