
Measuring a retailer's price image: KPIs

Price perception is a subjective perception driven by flagship products (KVI), not by an overall statistical average. For the reader, mastering this lever makes it possible to build customer loyalty without sacrificing overall profitability. A key point? Only 2% of products account for 80% of a retailer’s price perception.
The goal of BOOPER’s Price Assessment is to objectively evaluate this perception rather than speculate about it: to thoroughly analyze your positioning relative to the competition, product by product.
A retailer may be mathematically cheaper than its competitors yet still be perceived as expensive by its customers. This discrepancy often stems from poor management of high-turnover items, as consumers tend to remember only a few benchmark prices when judging an entire store.
To effectively manage your profitability without compromising your appeal, it is essential to accurately measure your retail pricing strategy. We will explore how to identify your strategic products and which metrics to track to align your actual pricing with market perceptions.

Price-image: A Simple Definition (and Why It’s Different from Competitiveness)
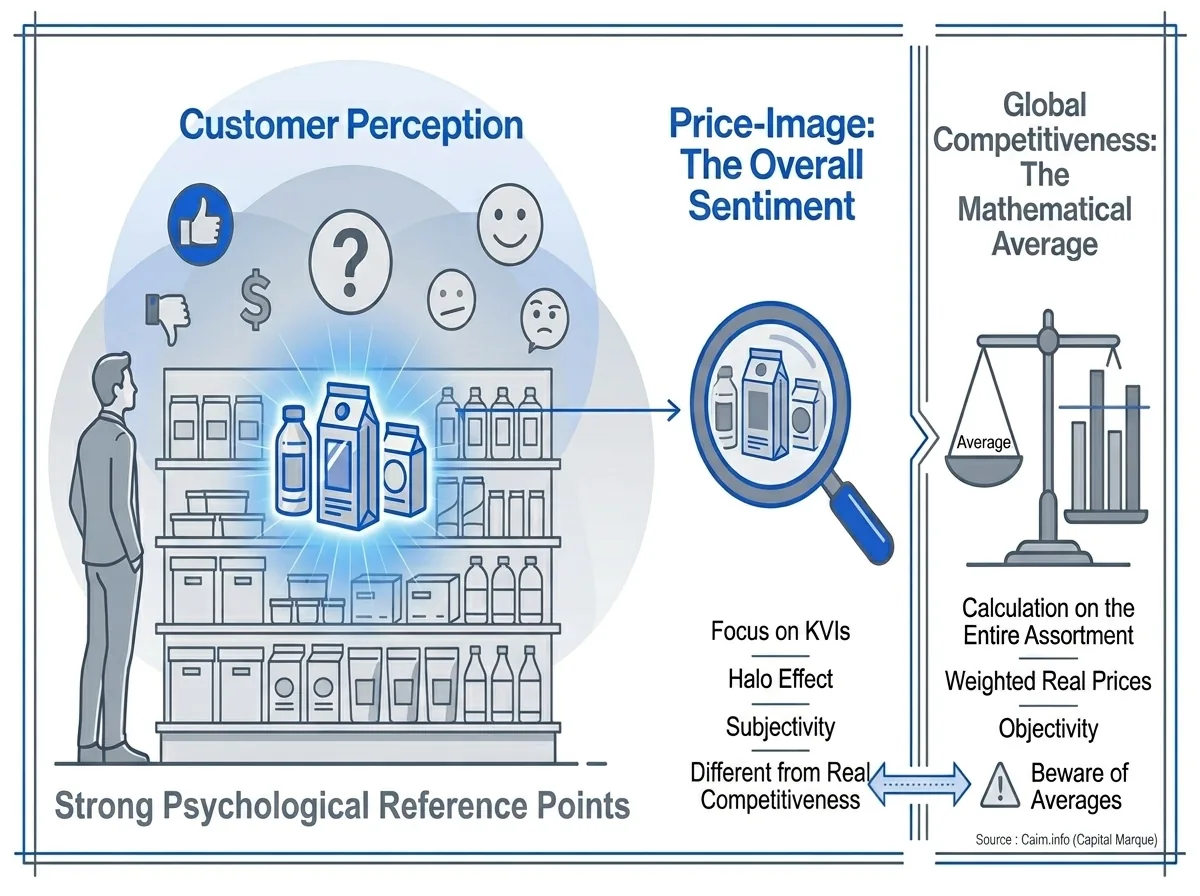
Price image is the subjective perception of a brand's prices by customers , dictated by flagship products (KVI). It differs from actual competitiveness because it is based on strong psychological anchors.
This distinction is key because it explains why a retailer can be perceived as expensive even though most of the items in its catalog are priced low.
Price image = customer perception, based on a few visible products
Price perception is an overall impression. Customers use only a few reference prices—often those of the most visible products—to judge an entire store.
This image is multifaceted. It is linked to access and service to build brand equity of a retailer.
It is a complex structure.
Overall competitiveness ≠ price-image (be careful with averages)
We must not confuse the mathematical average of prices with perception. A retailer may be cheaper on average but appear expensive when it comes to its flagship products.
Broad metrics are dangerous. They often mask critical drop-offs on the pages your customers visit most frequently.
In the IFOP survey on retailers’ quality-to-price image (Wave 3, August 2025), the gap between the top-rated retailer, E.Leclerc at 6.8/10, and its closest competitors (Intermarché and Auchan at 6.2/10) is just a few tenths of a point: perception hinges on details, not on the entire product lineup.
Why brand image hinges on Key Value Items (KVIs)
Once we’ve distinguished between perception and reality, we need to take a closer look at the products that drive sales on the shelves.
What is a KVI?
Key Value Items are products that are purchased frequently and for which consumers have a strong price memory. Milk and bottled water are typical examples of such items for consumers.
These items serve as a guide for customers. If they are considered too expensive, shoppers will perceive the entire store as overpriced.
On average, a French household already shops at 9 different retailers per year: in other words, the prices of the few key brands it chooses are constantly compared, with no margin for error (Kantar Worldpanel, 2023).
How to Select a KVI Basket (Simple Method)
The selection process is based on an analysis of sales volume and market penetration. It is necessary to cross-reference checkout data with the brand awareness of national brands. Entry-level products remain a priority.
Here are the criteria for identifying your best-selling products:
- Sales volume (top 20%)
- Purchase frequency
- Promotional visibility
- Price sensitivity tested
Weighting: Why Not All Products Count Equally
The use of weighting factors is essential to reflect reality. When making a calculation, a liter of milk carries much more weight in the customer’s mind than a specialized toothbrush.
Without this weighting, your price index remains mathematically accurate but commercially inaccurate. Customer perception does not follow a simple arithmetic mean.
Endogenous and exogenous pricing data must be validated before measurement (otherwise the results will be biased)
Identifying the right products is one thing, but collecting clean data is another—and a much more technical one at that.
Net price vs. listed price (sales, coupons, bundles)
Beware of the "list price" trap. Instant promotions and loyalty discounts alter the actual price at the register. These tactics make all the difference for the customer.
Compare what the customer actually pays. Ignoring promotional tactics completely skews the price-image analysis. The net price remains the only reliable metric for your assessment.
Availability / Out of stock (prices not comparable)
Out-of-stock items undermine the validity of your analysis. A very low price on an unavailable product does not help your pricing strategy; it frustrates the customer. It’s a broken promise.
Exclude out-of-stock products from index calculations to maintain consistency. A product that is out of stock no longer affects the perception of actual in-store competitiveness.
Omnichannel: brick-and-mortar stores, e-commerce, marketplaces
Price differences between online and in-store are common. Customers now check prices on their smartphones while standing in front of the shelves. Price transparency is no longer an issue.
Collect feedback across all touchpoints simultaneously. This is essential for understanding how your customers perceive your brand, regardless of the sales channel used.
66% of French consumers use a retailer’s in-store app to compare prices before making a purchase: a brand’s price image is now shaped as much by mobile devices as by price tags (Airship study, 2023).
Step by step: an 8-step method for measuring price-image
To put theory into practice, here is the step-by-step guide to follow for your dashboard.
Set target (overall / category / area)
Determine the scope of the study. Do you want to measure retail price positioning at the national level, or that of a specific retail location compared to its neighbor? The accuracy of the results depends on this initial choice.
Determine whether the issue affects the entire store or a strategic category, such as fresh produce. A local perspective often provides a more accurate picture of actual consumer habits.
Build the KVI basket (+ categories)
Group products into logical categories. Each category must have its own standout products in terms of image and price to be representative. These Key Value Items (KVIs) shape the overall perception.
Ensure that both national brands and private label products are included to cover all customer profiles . The basket should reflect typical weekly consumption to be credible.
Select competitors and channels
Identify who is really influencing your customers. It’s not always the one closest to them geographically, but often the one most active online. Price competition is now being fought on multiple fronts.
List the e-commerce sites and curbside pickup locations to monitor daily to stay responsive. The competitor price monitoring must include marketplaces to provide a comprehensive view of the market.
Reliable product matching (EAN/MPN/attributes)
Ensure that we are comparing apples to apples. Using the EAN code is the foundation, but attributes (weight, size) are essential for products without a unique code. Incorrect matching renders the entire study invalid.
Please note that automated matching must be reviewed by subject matter experts on a regular basis. Without this reliability, your retail price data will be completely skewed by technical errors.
Calculate pricing KPIs (index, gaps, dispersion)
Turn raw data into meaningful metrics.The 100price index remains the benchmark for gauging your position relative to the market. It is the essential barometer of your market positioning.
Analyze price dispersion. Excessively large price discrepancies on certain products can undermine your efforts across the rest of the shopping cart. The retail price index must remain consistent.
Set alert thresholds (corridors)
Determine tolerance zones. If your KVI index exceeds 102, immediate corrective action must be taken. These limits protect your pricing strategy in the public eye.
These price ranges allow us to avoid reacting to every minor, non-strategic fluctuation. This helps us avoid a price war that is both exhausting and detrimental to our profit margin.
Governance (who approves what)
Clearly define responsibilities. Should the category manager approve every price reduction, or does the system operate autonomously? A robust decision-making structure ensures the necessary responsiveness.
Smooth governance prevents delays that give competitors an advantage. The approval process must be streamlined to ensure that price changes are reflected in real time.
Link to pricing and promotions management
Integrate these measures into the overall sales strategy. The price-image strategy should guide the promotional calendar to maximize impact. Promotions directly influence the value perceived by the customer.
Use this data to balance immediate profit margins with long-term price strategy. Management must align financial objectives with a sustainable pricing strategy.
Essential KPIs for Price Image (Table)
To manage effectively, you need a handful ofprecise metrics rather than a mountain of numbers.
KVI Price Index (Overall & by Category)
This is the key indicator of your perceived competitiveness. It compares your weighted basket to that of the benchmark market. To ensure the calculation remains realistic, it must include the net price.
Tracking by category allows usto pinpoint exactly where image quality is degrading. This prevents local issues from being obscured by a misleading overall average.
Average Price Gap + Dispersion
Measuring the percentage gap between your company and the market leader allows you toadjust your positioning. The dispersion shows whether your prices are consistent or erratic across your entire product line.
Too many outliers create harmful confusion among end consumers. Unreasonable prices erode trust and undermine the perceived integrity of your pricing.
KVI coverage + data freshness
It is essential to check what percentage of your strategic portfolio is actually matched. Low coverage makes the index unreliable and skews your pricing decisions.
Freshness is key. A price recorded ten days ago is already outdated in retail. Data must be nearly real-time to be actionable.
Matching quality (false matches)
Monitoring the mismatch rate helps prevent strategic errors. A false match can lead you to mistakenly believe that your prices are too high compared to the competition.
Regularly auditing product links helps maintain trust in your reports. Without reliable matching, your analyses are nothing more than risky guesses.
Product Line Consistency & Psychological Pricing
Respecting the logical progression between formats enhances customer understanding . The price per liter should not be higher for larger formats. Psychological pricing also plays a major role.
An inconsistent pricing structure immediately raises doubts about the fairness of the prices. Consumers need logical guidelines to feel confident about their purchasing decisions.
Omnichannel gaps
It has become essential to systematically compare prices in-store versus at the drive-through. Loyal customers who shop across different channels often expect consistent pricing.
Unjustified price discrepancies undermine transparency and overall customer loyalty. Maintaining price consistency ensures a seamless customer experience free of unpleasant surprises.
Table: KPI → simplified formula → frequency → alert
Here is a practical guide to help you structure your internal reporting without any frills.
Key performance indicators
This table summarizes the key metrics for responsive and accurate pricing governance. It enables the measurement of retail pricing performance with analytical rigor.
| KPI | Simplified formula | Frequency | Alert threshold |
|---|---|---|---|
| KVI Price Index | Weighted average price (Brand vs. Competition) | Daily | Deviation > 2% from target |
| Price Gap | (Brand Price - Competitor Price) / Competitor Price | Weekly | Change > 3% on the KVI |
| Coverage rate | (Number of KVI tracked / Total theoretical KVI) × 100 | Weekly | < 95% coverage |
| Quality Matching | (Valid matches / Total matching attempts) × 100 | Daily | False positive rate > 1% |
| Dispersion | Standard deviation of price indices by region or category | Monthly | Outliers |
| Omnichannel Gap | (Online Price - In-Store Price) / In-Store Price | Daily | Any unintended differences |
Practical examples (3 short case studies)
Theory is always refined through real-world experience, whether you're a generalist or a pure web professional.
GSA: Protecting price image across 30–100 KVI
A hypermarket monitors its 50 best-selling products. It matches the prices of its nearest local competitor down to the cent. This strict policy prevents any loss of customers.
This strategy sacrifices profit margins on these items to drive foot traffic to the store. It is a necessary investment to boost customer traffic.
The result is an immediate increase in the perception of "good deals. " The overall price image improves automatically.
Expert: Analyzing KVI vs. Margin Drivers
A home improvement retailer is slashing prices on its top-selling drills. However, it maintains high profit margins on accessories. Its pricing strategy remains aggressive for highly visible loss leaders.
Customers come in for the visible promotion and fill their carts with items that are less price-sensitive. This helps maintain the overall profit margin.
E-commerce/marketplaces: price parity + exceptions
An online-only retailer uses algorithms to adjust its prices every hour. Its primary goal is to secure the "Buy Box" on e-commerce platforms. Responsiveness is the key to success here.
Automated monitoring allows you to detect aggressive price cuts by competitors in real time. This ensures consistent competitiveness without the need for constant human intervention.
Common Mistakes (and How to Fix Them)
Many retailers are fighting the wrong battle by trying to keep track of everything without a clear strategy. Here are the pitfalls to avoid.
Comparing without reliable matching
Relying on vague product names leads to massive pricing errors. A 6-pack is not a 12-pack. This confusion completely undermines the credibility of your analyses.
Solution: Automate matching using EAN codes and manually verify exceptions. This is the only way to ensure an accurate comparison between your products and those of your competitors.
Use a "catalog" average instead of a KVI basket
Bury your key products among 20,000 SKUs, and your catalog will lose all meaning. Customers don’t see everything. Their attention is focused on just a few standout items.
Focus your efforts on the 2% of products that account for 80% of revenue. These Key Value Items (KVI) determine your retail price strategy.
Ignore promotions/net price
Forgetting that the competitor is offering 50% off the second item skews your perspective. The price you pay is the only reality. Calculations based on list prices are often misleading.
Include promotional details in your statements to ensure accuracy. Customers, however, always calculate their actual savings at the checkout.
Forget omnichannel
Thinking you’re protected by the store’s physical walls is an illusion. Customers compare everything, everywhere, all the time. The smartphone has become the go-to shopping assistant on the sales floor.
Keep an eye on the online prices of your direct competitors, even for your in-store sales. Price perception now plays out across all touchpoints simultaneously.
Measuring without thresholds or governance
Having data without taking action is a waste of time. Who decides to lower the price when the alarm goes off? Without a clear process, your reports will go unheeded.
Establish streamlined decision-making processes to stay ahead of the competition. Responsive governance transforms raw data into a real and immediate competitive advantage.
Checklist: Implementing price-image tracking
To make sure you don't miss a thing, here is your operational roadmap for launching your monitoring project.
KVI Checklist
Identify your strategic products by analyzing your sales volumes alongside their media exposure. This forms the basis of your brand perception.
- Top-selling by volume
- Items in the flyer
- Category leaders
- Budget-friendly products
Data & Competition Checklist
Target your direct competitors and verify the reliability of your sources. Without your own data, your analysis will be worthless.
- List of direct competitors
- Target URLs
- Reading frequency
- Matching method
Dashboard Checklist & Routines
Set up your management tools and organize decision-making processes. Data must be quickly translated into concrete action.
- KPI Dashboard
- Alert thresholds
- Weekly Pricing Committee
- Pricing Alert Workflows Validation
Conclusion: Managing Your Price Image for Long-Term Success
Controlling how your prices are perceived is the most powerful way to build customer loyalty without undermining your profitability.
Identifying your KPIs and ensuring flawless product matching is essential. Measuring retail pricing is no longer an option but an absolute strategic necessity. This allows you to focus your pricing efforts where customers actually notice them.
Take action by establishing clear governance and alert thresholds. A powerful monitoring tool transforms raw data streams into straightforward operational decisions. This is the key to maintaining control over your positioning.
Finally, integrate these insights into your dynamic strategic pricing and promotions. This will help you maximize your results while strengthening the consistency of your omnichannel offering. Reliable data remains your best ally for achieving success.
Mastering your KPIs and ensuring reliable data matching are the cornerstones of accurately measuring your retail price positioning. Take action now on these strategic levers to turn your metrics into sustainable profitability. Manage your price perception today to dominate your market tomorrow.
To go further:
Is your price image really under control?
Many retailers manage their price image based on gut feeling. Let's see how to measure it using a reliable and actionable KVI basket.
FAQ
Price perception is your customers’ subjective view of your pricing level, which is shaped by a few flagship products (the KVI) rather than by your entire catalog. It is based on strong psychological anchors, not on a calculation.
That is why it is often disconnected from actual competitiveness as measured by the mathematical average: a retailer may be cheaper on the majority of its products yet still be perceived as expensive if its most visible items are poorly priced.
The gap between retailers comes down to small details: in the IFOP survey on the quality-price ratio (Wave 3, August 2025), E.Leclerc came in first with a score of 6.8/10, compared to 6.2/10 for Intermarché and Auchan—a difference of just a few tenths of a point, not a huge gap.
This image is also shaped by access and service to form a retailer’s brand equity: it is a complex construct that can never be reduced to a single number. We detail the construction of this composite indicator in our article on managing price perception using the right KPIs.
The selection process involves cross-referencing sales volumes and purchase frequency with the brand awareness of national brands. Entry-level products remain a priority, as do category leaders, which customers systematically compare.
Four criteria guide this selection: sales volume (aiming for the top 20%), purchase frequency, promotional visibility, and tested price sensitivity. These items serve as a guide for the customer: if they are considered too expensive, the entire store is perceived as overpriced.
According to Kantar Worldpanel (2023), the average French household already shops at 9 different retailers per year: the prices of the few key indicators it tracks are therefore compared on an ongoing basis, with no margin of error.
Once the shopping basket has been assembled, weighting remains essential: a liter of milk carries much more weight in the customer’s mind than a specialty toothbrush, and ignoring this fact makes the index mathematically accurate but commercially inaccurate. The prioritization method is discussed in our article on the products to prioritize when facing competition.
The method involves dividing your price by that of the benchmark competitor, then multiplying the result by 100—a score of 100 means you are perfectly aligned with the market. For strategic purposes, this calculation is based on a weighted average of the entire KVI basket, not on a product-by-product basis.
Using formulas such as Jevons’ formula makes it possible to refine this measure by preventing extreme prices from skewing the perceived competitiveness indicator.
To be realistic, this calculation must include the net price—with promotions and discounts factored in—since an index based on the list price never reflects what the customer actually pays at the register. Manually tracking this calculation quickly reveals its limitations; we detail these in our article on the limitations of Excel for price monitoring.
Tracking by category, rather than using a single overall index, makes it possible to pinpoint exactly where image quality is deteriorating, rather than diluting local problems into a misleading average.
The frequency depends on the sales channel. For e-commerce KPIs, data must be collected daily in order to respond to competitors’ algorithms, which sometimes adjust their prices several times a day. In brick-and-mortar stores, weekly data collection is generally sufficient to track market trends.
Consistency is key: a price recorded more than ten days ago is already outdated in retail and can lead to incorrect pricing decisions. We explain why in our article on the impact of up-to-date competitive data on your decisions.
According to an Airship study (2023), 66% of French consumers already use a retailer’s in-store app to compare prices before making a purchase—price perception is now shaped just as much by mobile devices as by price tags, which makes it necessary to update price listings more frequently rather than less often.
Beyond the raw frequency, the coverage of the KVI basket as actually tracked is just as important: a daily reading of an incomplete basket is less reliable than a comprehensive weekly reading.
It is essential to calculate the net price after the immediate discount, because it is this final amount that truly impacts the customer’s perception at the register. Ignoring promotional mechanics completely skews the competitiveness analysis. This is one of the strategies we detail in our article on promotional pricing strategies in retail.
The benefits associated with loyalty programs, such as cashback, must also be factored into this calculation—the price actually paid by the consumer is the only reliable figure for your analysis.
A common pitfall is comparing list prices without taking into account that a competitor is offering 50% off the second item: the customer always calculates their actual savings at the time of payment, not based on the price displayed on the shelf.
Incorporating these promotional mechanisms into your reports is therefore essential to obtaining an accurate picture of your market position—it’s not just an optional extra.
The method involves collecting online prices using monitoring tools and systematically comparing them to your physical shelf inventory. Customers now compare prices on their smartphones right in front of the shelf, makingomnichannel consistency essential rather than optional.
You must also ensure consistency across your own channels—drive-thru, e-commerce site, and physical store—since unjustified discrepancies between online and in-store experiences seriously undermine transparency and customer loyalty. We explore this topic in more depth in our article on omnichannel consistency in dynamic pricing.
For a pure player, this approach goes a step further: prices can be adjusted hourly, with a primary focus on securing the Buy Box on marketplaces, where responsiveness is the key to success.
The smartphone has become the number one shopping assistant on the sales floor; monitoring only your in-store prices is like ignoring half the arena where your price image is actually at stake.
Opt for price intelligence software and automated matching solutions rather than manual tracking, which quickly becomes unmanageable and carries a high risk of data entry errors once the KVI product portfolio exceeds a few dozen SKUs.
These tools transform complex data—such as prices, promotions, availability, and channels—into actionable dashboards, featuring metrics like the KVI Price Index, the Price Gap, and the coverage rate, which are tracked at a frequency tailored to each channel.
Product matching remains the primary area of concern: automation based on EAN codes must be supplemented with attributes (weight, size) for products without a unique code, and regularly verified by subject-matter experts. Improving reliability is the focus of our article on how to ensure reliable product matching.
However, a tool without an associated governance framework remains limited: alert thresholds and the approval process are just as important as the quality of the collected data when it comes to turning a report into a decision.
The most common mistake is comparing products without rigorous matching: a 6-pack is not comparable to a 12-pack, and this confusion completely undermines the analysis. Automation using EAN codes, supplemented by manual validation of exceptions, remains the only way to obtain a reliable comparison.
Relying on a catalog average rather than a weighted KVI basket obscures strategic information: the customer does not see the whole picture; their perception focuses on the 2% of products that account for the bulk of the price image.
Ignoring promotions and the net price also skews the analysis, as does overlooking the omnichannel approach—believing that the physical barrier of the store offers protection is an illusion when customers are comparing everything, everywhere, all the time.
Finally, measuring data without defining alert thresholds or establishing clear governance renders the data useless: there is no point in collecting information if there is no rapid decision-making process in place to adjust prices as soon as a deviation is detected. These governance errors are similar to those we list in our article on the 7 pitfalls to avoid in your pricing strategy.
To frame the initiative, consult our pricing project methodology.

The volume sold during a promotion does not indicate whether it created value: part of it comes from similar products (cannibalization), and another part from purchases that were simply brought forward.
Each promotional scenario must be costed out prior to launch using the same metrics: base sales, actual incremental sales, cannibalization, carryover, halo effect, net margin for the category, and cost per unit actually gained.
Margin-volume arbitrage can then be explained: a stated objective, visible forecasting factors, constraints adhered to, and a documented validation process.

A national food retailer with more than 1,700 stores and several million price points per year: With Booper, its pricing teams simulate the impact of each decision on margins, competitiveness, and price perception before implementing it.

Key takeaway: Pricing, promotions, and markdowns are three factors that constantly influence one another, but are still managed using separate tools at most retailers.
This fragmentation creates inconsistencies that are invisible in the short term (a muddled pricing image, margins eroded by promotions that aren’t properly coordinated with markdowns) but costly in the long term. Gartner has, in fact, formalized this convergence as a distinct market category: unified optimization of pricing, promotions, and markdowns.