
Competitive Benchmarking: Compare Your Prices to the Market
On this page
Does your overall price index hide sections that are too expensive?
Schedule a meetingDiscover our price monitoring softwareCompetitive benchmarking isthe structured comparative analysis of prices, product assortments, and promotional offers between a retailer and its direct competitors. More structured than price monitoring, it relies on composite indicators (price index, promotion rate, assortment depth) tracked over time and by category.
The Essentials in 6 Questions
A comparative dashboard showing how you stack up against the market.
Pricing, sales management, category managers.
At least once a week; every day for e-commerce.
By department and category, compared to a select group of competitors.
Assess the price position objectively and identify opportunities for arbitrage.
Weighted price index, promotional rate, product assortment depth.
Why Conduct a Competitive Benchmarking Study
Because it replaces impressions with numerical metrics and shows exactly where adjustments are needed.
- Assess the pricing position based on a sample of competitors.
- Managing by Category: A benchmark by department reveals where you're competitive and where you need to make adjustments.
- Facilitate decision-making by using a shared dashboard with the sales management team.
More structured than a simple price monitoring system, it allows you to manage your price image over time.
Real-world example: an index of 102 that hides 95 and 108
An overall price index of 102 masks significant disparities across departments; targeted adjustments bring it down to 99 in six months.
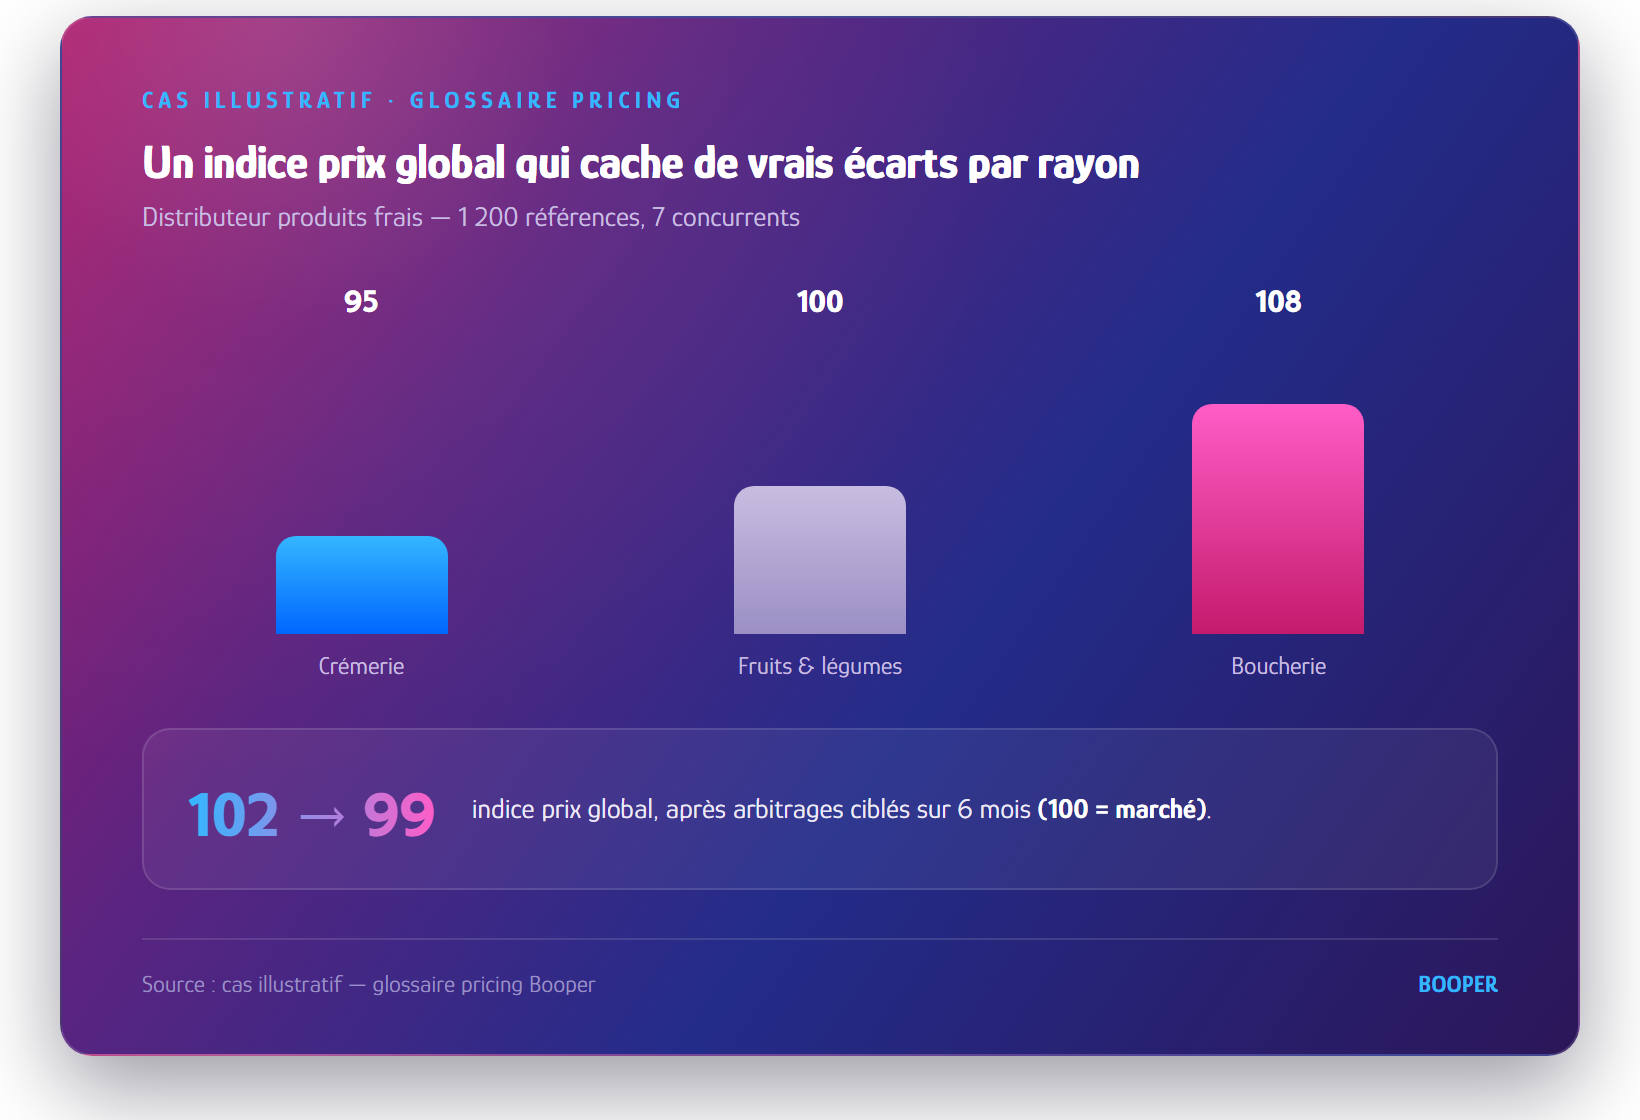
A fresh food distributor compares 1,200 products each month across 7 competitors (4 brick-and-mortar stores, 3 online grocery sites). Dairy products score 95 (very competitive), meat products 108 (expensive), and fruits and vegetables 100: efforts are focused where there is a real gap.
How do you create a competitive benchmark?
By selecting a relevant index, weighted indicators, and a frequency appropriate for the market.
| Choices | Best Practice |
|---|---|
| Panel of Competitors | Direct sellers, market leaders, local players, pure players, or marketplaces, depending on the category. |
| Indicators | Weighted price index, promotional rates, availability, private-label brands, product assortment. |
| Frequency | Daily in e-commerce, weekly or monthly elsewhere. |
The data comes from our competitor price surveys; a price analysis then transforms the benchmark into an action plan for each department.
3 Mistakes to Avoid in a Benchmark
A panel that is too broad, an unweighted index, or a pace that is too slow can skew the results.
- Too broad a benchmark: irrelevant competitors skew the metrics.
- Unweighted index: A simple average gives a bestseller the same weight as a niche title.
- Static benchmark: A quarterly schedule is too slow; aim for at least one update per week.
Frequently Asked Questions
Short answers to the most frequently asked questions about competitive benchmarking.
What is a competitive benchmark?
Competitive benchmarking is the systematic comparative analysis of prices, product assortments, and promotional offers between a retailer and its direct competitors. It relies on aggregate metrics (price index, promotion rate, assortment depth) tracked over time and by category.
What is the difference between benchmarking and competitive intelligence?
Market intelligence continuously monitors market trends; benchmarking systematically compares prices, product assortments, and promotions across retailers to identify discrepancies and opportunities.
What metrics should be tracked in a retail benchmark?
Price indexes, promotions, price differences, availability, private-label brands, product assortment, delivery times, and—depending on the category—customer reviews or services.
How often should you run a benchmark?
Daily in e-commerce or in highly competitive categories; weekly or monthly elsewhere.
How Can You Use a Benchmark to Inform Your Pricing Strategy?
Without copying competitors' prices: it is used to measure competitiveness for strategic products, simulate scenarios, and balance margin, volume, and price image.
Key Takeaways
- The benchmark structures the comparison with a selected group of competitors.
- It tracks a weighted price index and other indicators, by department.
- It is updated at least once a week and guides targeted investment decisions.
Would you like to compare your prices with those of your competitors?
Booper continuously compares your prices, product selection, and promotions with those of your competitors.
Let's talk about your price benchmark →Discover our price monitoring softwareYou might also be interested in these articles

For a retail chain in France, seven pricing solutions are most frequently used: BOOPER and Pricemoov (French publishers), RELEX Solutions, Competera, Pricefx, Revionics, and Blue Yonder. This comparison presents them in a table, then details 10 selection criteria and the French regulations that software must comply with.
The best pricing software is one that combines AI and business rules, connects to your data without heavy IT work, and leaves final validation to your teams.

Many organizations receive a report on competitors’ price differences every morning, but few have a genuine strategy. The difference lies in three questions that must be asked before implementing the system: Why collect this data? What specifically should be tracked? And what decisions should be made once a price difference is identified?
Key point: Key value items (KVI) —the products whose prices customers remember—typically account for 15 to 25 percent of a category’s sales. Focusing monitoring efforts on this small core group is more cost-effective than trying to track everything with the same intensity.

The timeliness of a competitor’s price data is not a binary proposition: it degrades continuously, like a perishable asset. A decision based on data that is a few days old may be incorrect by the time it is implemented, even if the dashboard displays an apparently reliable gap.
Academic research confirms this: the average time between two price changes at multichannel retailers fell from 6.7 months to 3.7 months between 2008–2010 and 2014–2017, a sign that the actual pace of the market has accelerated significantly.