
Transitioning from Excel to a Dedicated Pricing Solution

Migrating from Excel to a dedicated platform safeguards your profit margins by eliminating the 10% rate of manual data entry errors. This transition automates pricing workflows and centralizes ERP/PIM data, ensuring essential omnichannel consistency. A methodical 8-step migration process helps optimize profitability and enables you to respond to competition in real time.
Ensuring a smooth transition—including team training and adoption—is precisely the role of BOOPER’s Change Management module.
A simple Excel file generates an average of 10% data entry errors and hampers your omnichannel responsiveness. When faced with massive data flows, this spreadsheet becomes a bottleneck that directly threatens your net margins and your pricing reputation.
Maintaining consistent pricing across the web and in-store requires a level of agility that can only be achieved with a dedicated tool. To replace Excel-based pricing without disrupting your operations, we break down the key steps of a successful migration, from data auditing to deployment of a pricing tool with centralized governance.

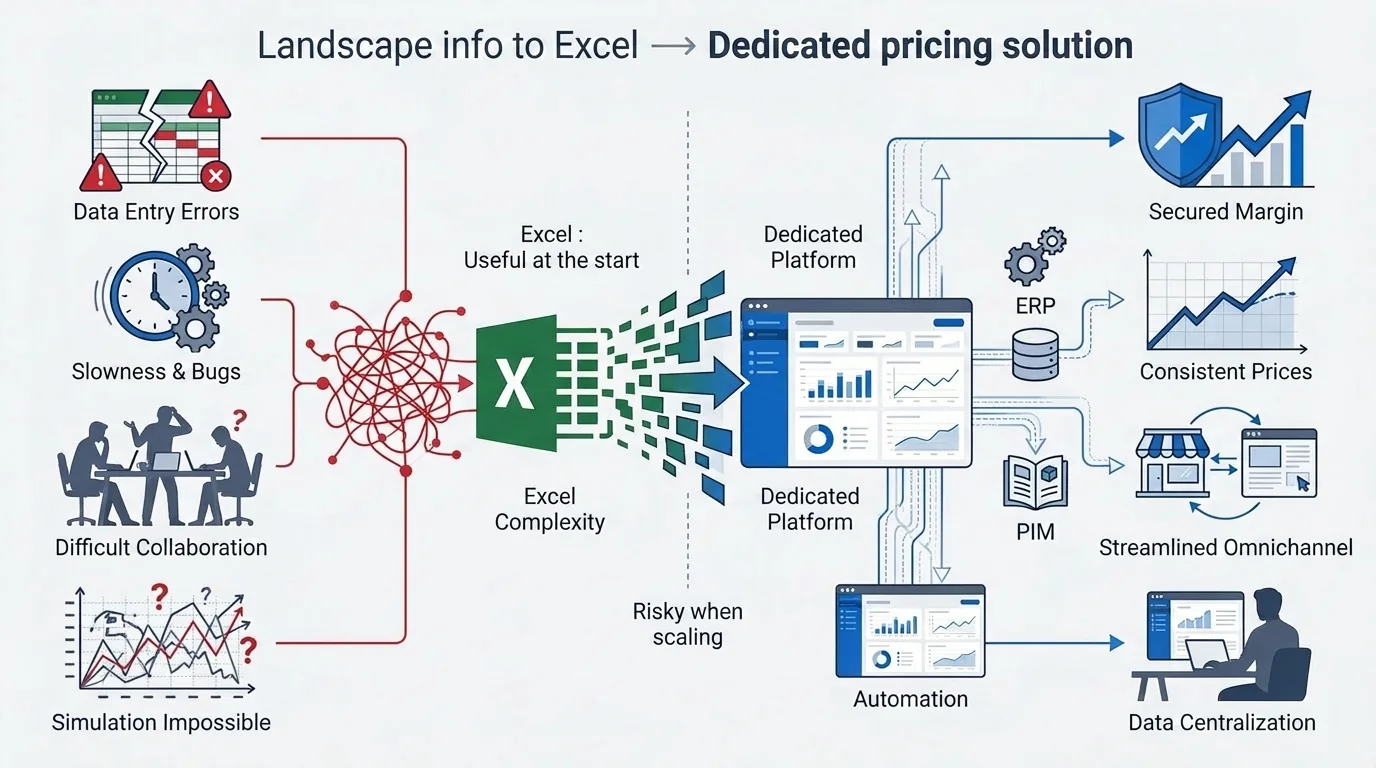
Excel: useful at first, risky as you scale
Managing prices in Excel results in a 10% data entry error rate and hinders omnichannel operations. A dedicated platform automates workflows, safeguards margins through price corridors , and centralizes ERP/PIM data—which is essential for detecting the first signals of endogenous and exogenous pricing of operational friction.
But how can you tell if your file has become a ticking time bomb?
Signs That Excel Is Holding You Back (7 Symptoms)
Files quickly become overloaded, and macros break without warning. The lack of a version history makes it impossible to conduct a reliable audit. Collaboration becomes difficult because versions overwrite each other, creating confusion about the latest valid price.
It’s impossible to run simulations without real data. Spreadsheets don’t sync with your inventory or competitors. Information is often outdated by the time it’s manually entered.
The teams are burning out. Time spent on corrections is taking the place of strategy.
This is the percentage of business spreadsheets containing at least one error, according to field audits compiled by researcher Raymond Panko (University of Hawaii)—a risk that increases with every copy-and-paste of prices.
Question: Has your Excel pricing spreadsheet become a risk?
Use these 3 points to assess whether your spreadsheet-based management is jeopardizing your profitability.
Business risks (margin, price-image, omnichannel inconsistencies)
A formula error directly impacts the net margin. This poses a massive, hidden financial risk for retailers. Profits melt away without any immediate warning.
The disconnect between online and in-store pricing erodes customer trust. These pricing inconsistencies seriously damage your overall brand image.
Compared to pure-players, Excel is too slow to react. You ’re losing ground every day.
This is the average increase in operating profit achieved by a company that raises its price by just 1 percent, assuming constant sales volumes (McKinsey, “The Power of Pricing”). A calculation error in Excel costs proportionally as much.
What a pricing platform offers (and why it’s a game-changer)
If Excel is showing its limitations, it’s because modern agility requires a tool capable of centralizing pricing intelligence while ensuring the security of every operation.
Source of truth: pricing + governance (workflows, logs)
The platform serves as your single source of truth for pricing. Every change is tracked, time-stamped, and assigned to a specific user, ensuring complete transparency.
Approval workflows automate the review process. A manager must approve changes that exceed a defined threshold for price reductions or increases.
In short, no more scattered files. Everyone is finally working with the same reliable, shared data.
Rules & Safeguards (corridors, price floors, exceptions)
Price ranges and automatic minimum prices protect your margins. These rules prevent you from selling at a loss, even in the event of a calculation error or an aggressive promotion.
Managing local exceptions becomes simple. You can override a global rule for a specific store without breaking the entire system.
Scenarios / “What-if” simulations
Testing before publishing changes the way you work. You can instantly simulate the impact of a 2% increase on volume and overall margin.
Comparing multiple strategies takes just a few clicks. It’sthe ultimate decision-making tool for your teams.
Seasonal uncertainty is fading. Forecasts are becoming more concrete.
Competition: monitoring + reliable matching
Automating price tracking eliminates tedious tasks. No more manually copying and pasting competitors' prices into a spreadsheet every morning.
Smart matching, or chaining, ensures reliability. The tool recognizes that two products are identical even though they have different names among your competitors.
You gain greater responsiveness to market conditions. You can adjust your pricing strategy in real time based on your own strategy.
Built-in promotions & markdowns
Manage the entire product lifecycle efficiently. From the initial launch to end-of-line markdowns to clear out inventory.
Coordinate promotions across all channels. Customers see the same discount both online and in-store, with no inconsistencies.
Maximize sales without sacrificing profit margins. The algorithms suggest the right markdown.
IT Integrations (ERP/POS/PIM/E-commerce/BI)
Data flows seamlessly between systems. The calculated price is sent directly to the ERP system and the electronic price tags.
Linking inventory and purchase costs is essential. Pricing becomes dynamic and truly aligned with your logistics reality.
Feed the BI system for accurate reports. Data flows without manual human intervention.
Preparing for the migration: data and prerequisites
Before installing any software, you need to clean up your data to lay a solid foundation.
Net price vs. list price, costs, margins
The first step is to clearly distinguish between the list price and the net price after discounts. Include all purchase costs when calculating your actual margin. Otherwise, your projections will remain approximate.
Next, define the target profitability metrics by product family. Each category can have its own method for calculating gross margin. This segmentation allows you to monitor performance with precision.
Finally, ensure consistency in tax calculations (VAT). Calculation errors often stem from improper handling of pre-tax and tax-inclusive amounts. A well-organized system helps avoid unpleasant tax surprises.
Inventory/out-of-stock items, channels, promotions
Take inventory levels into account when making decisions. You shouldn’t lower the price of a product that’s about to go out of stock. Scarcity should protect your margin.
Map out the various sales channels. Each touchpoint may have its own promotional constraints. Omnichannel marketing requires seamless coordination.
Track your past transactions. Understanding what worked helps you plan for the future. Past data is your best teacher.
Product catalog: attributes, variants, EAN/MPN
Clean up the PIM to ensure unique identifiers. EAN and MPN codes are the cornerstones of matching. Without them, effective comparison is impossible.
Manage size and color variations. Pricing should be consistent within the same product line. Avoid inconsistent pricing for similar products.
Standardize product descriptions. Clarity makes it easier for algorithms to do their job. Structured data ensures a smooth migration.
Competition: Specific Comparison Rules
Identify who your real competitors are strategic. You don’t compete with a web leader the same way you do with a local discount store. Here are the key criteria for identifying them:
- Geographical proximity
- Range width
- Pricing strategy
- Included services
Establish strict matching rules. Should a 3-pack be compared to a single unit? The accuracy of the matching process determines the relevance of your alerts.
Determine how often to check the data. Some markets fluctuate hourly, while others do so weekly. Tailor your monitoring to the actual volatility of your industry.
An 8-step method for migrating without disrupting operations
Migration isn't a technical "Big Bang," but a methodical transition that safeguards your daily revenue.
Mapping Excel files and actual usage
The first step is to identify all the spreadsheets used by the Category Managers. We need to understand who edits what and how often so that nothing is overlooked. Each file often reflects a specific business practice.
Identifying "custom" formulas and hidden macros helps avoid unpleasant surprises. These processes must be translated into logical rules in the future system.
Identifying bottlenecks is essential. Where are we wasting the most time right now?
Set goals and KPIs (margin, competitiveness, price-image)
Defining what success means to you is the top priority. Is it a 1% increase in profit margin or time savings for your teams? Without a clear direction, the tool will be nothing more than an expense.
Choosing clear performance indicators ensures rigorous monitoring. Track the competitive pricing index and data entry error rate to validate the transition. These metrics demonstrate the project's value .
It is essential to align leadership and teams. Everyone must be working toward the same goals.
Segment products (KPI / margin drivers / long tail)
Identifying the products that drive traffic—the so-called KVI products—requires special attention. For these items, price elasticity is at its highest, and there is no room for error, as any mistake could damage your price reputation. These are your flagship products.
Identifying margin drivers helps ensure profitability. The goal here is to optimize margins without sacrificing sales volume. This requires careful management.
Treating the long tail differently frees up operational time. These slow-moving items can be further automated without significant risk.
Building "golden data" (a reliable data repository)
Merging data sources to create a single record is a massive undertaking. It is the most time-consuming step, but also the most rewarding for the rest of the project. Scattered data is useless data.
Eliminating duplicates and data entry errors ensures the reliability of future calculations. The platform will only perform well if the data is clean from the moment it is imported. Data cleansing is mandatory.
According to Gartner, this is the average annual cost incurred by an organization due to poor-quality data—the heaviest burden for those migrating from unaudited spreadsheets (Gartner, 2020).
Automating update workflows secures the system. Data must always be up to date.
Define rules & governance (who approves what)
Creating a responsibility matrix (RACI) clarifies everyone’s role. Who proposes a price, who approves it, and who ultimately publishes it? This structure helps prevent costly human errors.
Setting automatic alert thresholds protects your margins. If a price fluctuation is too sudden, the system should pause to allow for a manual review. This is your safety net.
Documenting decision-making processes strengthens cohesion. Transparency helps prevent conflicts between departments.
Choose a platform (criteria + checklist)
Evaluating solutions based on their integration capabilities and user-friendliness is a strategic decision. The software must be easy for business teams to adopt without extensive training to ensure a quick return on investment. Here are the key points to consider:
- Native ERP connectors for synchronization.
- Simulation module for testing scenarios.
- Promotion and markdown management.
- Responsive and knowledgeable customer support.
- Technical scalability to keep pace with your growth.
Checking the provider’s financial and technical stability is a basic precaution. You’re entrusting the core of your business to this tool, so you need to have complete confidence in it. Don’t overlook the issue of long-term sustainability.
Requesting a demo using your own data is the ultimate test. It’s the only true test.
Driver (1 category + 1 channel + safety rails)
Launching the project on a limited scale helps minimize initial risks. Choose a product category that is representative but not too risky to get the system up and running. This full-scale test is a learning experience.
Testing workflows in real-world conditions allows you to fine-tune the settings. Adjust the pricing rules based on initial feedback from users. Flexibility is the key to success.
Measuring results after 4 weeks provides a clear picture. Verify the ROI before rolling it out on a larger scale.
Standardize (training, procedures, monitoring)
Rolling out the tool across all departments marks the end of the transition. Support the change with regular training sessions for all affected employees. Adoption must be comprehensive to be effective.
Establishing weekly price review rituals keeps momentum going. Use the platform’s dashboards to manage your business in real time. Data finally replaces intuition.
The ultimate goal is to adopt a mindset of continuous improvement. Refine your pricing rules over time.
Excel vs. Platform: Comparison Chart
To settle the matter once and for all, let’s compare the two approaches based on the key factors driving your sales performance.
Factual comparison of performance
This table summarizes the key differences between manual management and automation. It highlights the benefits in terms of security and time savings.
| Criterion | Excel (Manual) | Pricing Platform | Impact Business |
|---|---|---|---|
| Data reliability | Low (data entry errors) | High (single source) | Accuracy of margins |
| Audit & History | None (no logs) | Complete (traceability) | Compliance and Analysis |
| Execution speed | Slow (time-consuming) | Instant (automated) | Market responsiveness |
| What-if simulations | Limited and risky | Progress (scenarios) | Strategic Security |
| IT integration | Manual (CSV imports) | Native (ERP/PIM/POS) | Real-time feed |
| Omnichannel Management | Complex (silage) | Centralized | Price consistency |
Actually, do you see the problem? Sticking with Excel means accepting a constant risk to your income, whereas a dedicated platform safeguards every penny.
How to Choose a Pricing Platform (10 Criteria)
Choosing the right tool is critical to the success of your digital transformation and to gaining your teams’ buy-in.
Functional (pricing, promotions, markdowns, competition)
Prioritize features that meet your day-to-day needs. Markdown and promotion management should be built-in. This allows you to effectively manage the product lifecycle.
Assess the sophistication of the competitive intelligence module. The tool must be capable of processing massive volumes of external data. Real-time price comparisons are essential to remain competitive.
Make sure that business rules are customizable. Avoid solutions that are too rigid or act like "black boxes." You need to maintain control over your pricing strategies.
Technical (integrations, scalability)
Consider how easily it integrates with your existing tools. The APIs must be well-documented and robust for the IT system. Near-real-time synchronization with your ERP is a major advantage.
Test the platform's data processing speed. The platform must be able to handle the growth of your catalog. A cloud-based architecture often provides the flexibility needed to handle traffic spikes.
Verify the security of your hosting providers. Your pricing data is highly confidential. Robust security measures are essential.
Organization (workflow, adoption, training)
The interface must be intuitive for non-technical users. A steep learning curve could cause the project to fail. Here are the key points to keep in mind:
- UX Design
- Built-in online help
- User Rights Management
- Customizable reports
Assess the quality of post-purchase support. Good customer service is essential during sales periods. Having a live representative available via chat or phone makes all the difference.
Plan for ongoing training modules. Your teams need to stay proficient in using the tool. This is the only way to ensure long-term success for your business.
To evaluate the leading platforms on the market based on these criteria, our guide to the best pricing software in 2026 compares five categories of solutions.
30/60/90-Day Action Plan
To help you stay on track, here is a practical roadmap for your first three months of transition.
30: audit + quick wins + scope definition
The first month is dedicated to an initial assessment. Identify the most costly Excel errors to generate immediate results. Analyze the rate of duplicate entries and empty fields.
Define the scope of the pilot project. Bring together the stakeholders to approve the strategic objectives and budget. Select your key performance indicators.
Clean up your first critical datasets. Quality starts from day one. Now is the time to verify GDPR consent.
60: driver + dashboards + rules
Set up the platform for the selected category, such as high-margin products. Configure the initial dashboards to track performance in real time. View your inventory.
Test the automatic pricing rules on a sample. Adjust the price ranges and floor prices based on market reactions. Simulate your initial promotional scenarios.
Train your first key users. They will become your internal ambassadors. Their feedback is vital for the next steps.
90: Scaling + Governance + Continuous Improvement
Expand the platform’s use to your entire catalog, including the long tail. Now is the time to permanently phase out those outdated Excel files. Centralize your “source of truth” price repository.
Standardize governance and approval processes. Every employee must understand their specific role in the workflow. Audit logs now ensure complete transparency regarding every change.
Analyze the initial overall results across all channels. Compare KPIs with baseline figures to demonstrate ROI. Refine your end-of-season markdown strategies.
Common mistakes (and how to avoid them)
Even with the best intentions, certain common pitfalls can slow down your migration if you’re not careful.
Start with the tool without your own data
The tool won't magically fix incorrect data. Take the time to clean up your data before installing any software. You need to track down duplicates and empty fields right now.
An inaccurate purchase cost will result in an inaccurate price. The reliability of the source is essential to prevent a chain reaction of errors.
Prioritize quality over quantity. It’s better to have a small amount of data that’s accurate for your database.
Trying to automate everything at once
Full automation is a dangerous fantasy at first. Keep control over strategic decisions and KVI products. Losing control could be costly for your reputation.
Proceed in a step-by-step, logical manner. Let the algorithm handle the simplest tasks first, such as shelf-back products.
Keep a critical eye on things. Machines are helpful, but they don’t replace the professional expertise of category managers.
Forget about governance (exceptions, validations)
A tool without validation rules leads to operational chaos. Define who has the final say in the event of a dispute over a rate. Without a workflow, the risk of errors skyrockets.
Establish processes for handling exceptions. Business is full of unforeseen circumstances that require flexibility, such as responding quickly to competition.
Document every major decision. Your record is your best legal and business defense for justifying your pricing decisions.
Measuring ROI based solely on revenue
Revenue is only part of the equation. Focus instead on how your gross margin and time saved are changing. Rising revenue can mask plummeting profitability.
Emphasize the reduction in operational errors. Avoiding massive losses on sales is a direct and tangible benefit for your cash flow. This is where the tool pays for itself.
Keep employee satisfaction in mind. Employees who are less stressed by corrupted Excel files perform better in the long run.
Conclusion: Take the plunge to ensure your growth
Ultimately, migrating from Excel to a pricing platform is no longer an option for those who want to remain competitive.
Success depends on accurate data and clear governance. The tool is designed first and foremost to support your HR strategy. This systematic transition ensures immediate operational peace of mind.
Start an internal audit of your files today. Learn how BOOPER can provide expert support for these complex transformations. Switching toautomation will secure your processes starting tomorrow.
This will help you protect your profit margins and price image over the long term. It’s the foundation of a modern, agile retail business. Technology is finally keeping pace with your ambitions.
Replacing your Excel pricing system with a dedicated platform protects your margins, automates your workflows, and finally centralizes your data. By following our 8-step migration plan, you’ll eliminate manual errors and gain omnichannel agility. Take action now to transform your pricing strategy into a driver of profitable, sustainable growth.
FAQ
Yes, Excel may still be useful for one-off analyses, specific exports, or exploring isolated ideas. In such cases, it reverts to being a supplementary calculation tool—highly flexible for ad hoc needs—but loses its role as a central hub.
However, it is imperative that it no longer be considered the source of truth. The dedicated platform remains the sole control center for ensuring data consistency, with Excel now serving only as a satellite disconnected from operational workflows—exactly the opposite of the current situation, where the spreadsheet serves as both a calculation tool and a reference database, which results in the 10 percent data entry errors mentioned above.
This change in status also affects governance: every modification made to the platform is tracked, time-stamped, and attributed to a specific user, whereas a one-time Excel export, by its very nature, offers no traceability and must never serve as the official price.
For a retailer, the risk is therefore not the use of Excel itself, but its continued existence as a parallel data source: as soon as a file begins circulating again as a basis for decision-making, the omnichannel consistency that has been painstakingly rebuilt is once again undermined, as detailed in our article on the limitations of Excel for pricing management.
Business Intelligence (BI) is an analytical tool that examines the past to understand past performance. A pricing platform, on the other hand, is a forward-looking tool capable of determining and managing future prices in real time.
Unlike BI, which merely generates reports, the pricing platform is immediately actionable. It sends price orders directly to sales systems (ERP, POS, e-commerce)—this is exactly the IT integration described above: the calculated price goes directly to the ERP and electronic price tags, without any intermediate manual re-entry that would reintroduce the risk of error we’re trying to eliminate.
This distinction is also evident in price corridors and floor prices: a pricing platform can block a trade before it goes through, whereas a BI tool merely reports after the fact that a loss-making sale has occurred. One prevents, the other observes—this is precisely what our article on the definition and functioning of a pricing tool details.
For a retailer, these two tools are complementary rather than competitive: BI analyzes past performance to adjust strategy, while the pricing platform operates on a day-to-day basis to ensure that this strategy translates into actual prices across every channel.
A typical migration usually takes between 3 and 6 months, depending on the complexity of your catalog and the initial quality of your data. The audit and target schema phase takes about two weeks, followed by the import and deduplication.
This timeline corresponds to the 8-step method described in the article: mapping existing Excel files, setting objectives and KPIs, segmenting products into KVI, margin drivers, and the long tail, building the “golden data,” defining governance, choosing the platform, launching a pilot, and then scaling up. Each of these steps carries a different weight in the timeline—building the reliable data repository, or “golden data,” is consistently the most time-consuming but also the most rewarding, as is structuring the pricing organization that must support it.
A pilot program targeting a specific category can be up and running in as little as 8 weeks, with results measured after 4 weeks to validate the ROI before rolling it out to the entire catalog, including the long tail. It is this phased approach—divided into 30-, 60-, and 90-day action plans—that allows us to move forward without disrupting day-to-day operations.
For a retailer, this realistic timeline avoids the pitfall of a “Big Bang” approach: it’s better to have a pilot project validated in 8 weeks than to rush a full-scale migration based on a data repository that’s still in disarray.
To launch the platform, you must provide purchase costs, current selling prices, and inventory levels. Without these three fundamental pillars, no margin calculation or pricing rule can be considered reliable.
These three pillars correspond exactly to what the article refers to as data preparation prior to migration: distinguishing between the list price and the net price after discounts, incorporating full purchase costs to calculate an actual margin, and linking inventory levels to ensure that the price of a product on the verge of being out of stock is never lowered—scarcity must protect the margin, not be ignored by a system that is unaware of it, as detailed in our article on the true glass ceiling of pricing data.
Integrating competitive data is a significant advantage for refining your positioning, but it should come second—after the EAN and MPN codes have been cleaned up in the PIM to ensure reliable matching. It’s advisable to start with this simple foundation to avoid overloading the system, and then gradually enrich the data feeds.
For a retailer, sticking to this minimal foundation at the outset—rather than trying to integrate everything at once—helps avoid the classic mistake of a failed migration: connecting a sophisticated tool to data that is still unprocessed.
The platform uses separate management rules for each product category. Traffic-driving items (KVI) are monitored daily and strictly aligned, while promotions are planned in advance to ensure omnichannel consistency.
This segmentation directly follows the KVI/margin drivers/long tail logic described in the migration method: For KPIs, price elasticity is maximized, and errors are not permitted, as they would damage the price image; whereas for back-of-the-aisle margin drivers, the goal is to optimize margin without losing volume—see our article on the triangle of margin, competitiveness, and price image. The long tail, on the other hand, can be further automated without significant risk, freeing up operational time for teams.
The Markdown module then takes over to optimize the clearance of end-of-line items, using algorithms that suggest the right markdown rather than an arbitrary discount. Promotions are coordinated across all channels so that customers see the same discount both online and on the store floor, without any inconsistencies.
For a retailer, centralizing these three levers—KVI, promotions, and markdowns—in a single system prevents the strategic conflicts that arise when each product category is managed separately using different files, without an overall view of the overall margin target.
To ensure reliable matching, algorithms should be based on multiple attributes—such as EAN, MPN, or product descriptions—rather than on the product name alone. Establishing strict matching rules helps prevent situations where individual units are compared with multipacks, for example.
This rigor begins with data preparation: cleaning the PIM to obtain unique identifiers, managing size and color variants, and standardizing product labels are prerequisites for any accurate matching—without these clean identifiers, it is impossible to effectively compare two catalogs, even with the best algorithm on the market, as detailed in our method for ensuring reliable product matching. It’s also essential to identify in advance who the true strategic competitors are, based on geographic proximity, product range, price positioning, and included services.
Regular human review remains essential for validating the most critical matches, particularly for KVIs, where a matching error has a direct impact on pricing. By defining confidence scores for each match, you can disregard data with low reliability and ensure the accuracy of your alignment decisions rather than blindly automating them.
For a retailer, the frequency of data collection must itself be adapted to the actual volatility of the sector—a market that changes by the hour requires much more frequent matching and monitoring than a market that changes on a weekly basis.
Return on investment is primarily measured by changes in gross margin and a drastic reduction in manual data entry errors. Avoiding massive losses from sales caused by a broken Excel formula represents a direct and immediate benefit for the business.
This gain is in line with the orders of magnitude cited in the article: According to McKinsey, a price improvement of just 1% generates, on average, an additional 8% to 11% in operating profit at constant volumes—and conversely, an erroneous price change in an unsecured spreadsheet costs proportionally as much, with no price corridor to catch the error before it reaches the customer.
We must also recognize the value of the time saved by teams, who can shift their focus from tedious data entry to strategic analysis—a real benefit that doesn’t always show up in a traditional ROI calculation but results in teams that are less exhausted and more available to focus on strategy rather than correcting errors. ROI is typically achieved in less than a year, thanks to greater responsiveness to market conditions and fine-tuned optimization of every margin point.
For a retailer, measuring ROI solely based on revenue would be a classic mistake: rising revenue can mask plummeting profitability if those sales were made at a lower margin due to undetected Excel errors.
The first step is to conduct a thorough audit of your current Excel files to identify bottlenecks and the risk of duplicate data. Identify the most critical spreadsheet or the one that generates the most operational errors on a daily basis.
In practical terms, this involves mapping out the Excel files and their actual uses: taking inventory of all the spreadsheets used by category managers, understanding who edits what and how often, and then identifying “custom” formulas and hidden macros that will need to be translated into logical rules in the future system. This is primarily an inventory exercise—it’s not yet about choosing a tool.
Next, contact experts to get a cost assessment and define your target model—this assessment should be based on known benchmarks, such as the fact that 88% of professional spreadsheets contain at least one error, according to audits compiled by researcher Raymond Panko, a risk that grows with every copy-and-paste of a price. Change begins with this realization: automation is no longer an option, but a necessity to secure your growth in a complex retail environment.
For a retailer, this initial audit should not aim for immediate completeness but rather to identify “quick wins”: the Excel errors that are most costly to correct should be addressed first, in order to generate rapid gains that will help build buy-in for the rest of the project among teams and management.
Choose a solution that uses your existing files as a starting point, without requiring a complete overhaul of your information system, and that first automates the tasks Excel does poorly: volume calculations, simulations, and alerts. The migration takes place in stages: Excel, rules, hybrid AI, and then automation.

The volume sold during a promotion does not indicate whether it created value: part of it comes from similar products (cannibalization), and another part from purchases that were simply brought forward.
Each promotional scenario must be costed out prior to launch using the same metrics: base sales, actual incremental sales, cannibalization, carryover, halo effect, net margin for the category, and cost per unit actually gained.
Margin-volume arbitrage can then be explained: a stated objective, visible forecasting factors, constraints adhered to, and a documented validation process.

A national food retailer with more than 1,700 stores and several million price points per year: With Booper, its pricing teams simulate the impact of each decision on margins, competitiveness, and price perception before implementing it.

Key takeaway: Pricing, promotions, and markdowns are three factors that constantly influence one another, but are still managed using separate tools at most retailers.
This fragmentation creates inconsistencies that are invisible in the short term (a muddled pricing image, margins eroded by promotions that aren’t properly coordinated with markdowns) but costly in the long term. Gartner has, in fact, formalized this convergence as a distinct market category: unified optimization of pricing, promotions, and markdowns.