
Competitive pricing analysis: definition and methodology
On this page
Where are your prices too high, and where are they too low?
Schedule a meetingDiscover our price monitoring softwareCompetitive analysis is the systematic study of the prices, product assortments, promotions, and sales strategies of competing retailers. Broader in scope than a simple price comparison, it serves as the foundation for an informed pricing policy and combines data collection (web scraping, field surveys) with analysis (benchmarking, segmentation, scoring).
The Essentials in 6 Questions
An analysis of competitors' prices, promotions, product assortments, and positioning.
Pricing, sales management, category managers.
Published continuously:daily for e-commerce, weekly for mass retail.
Among 5 to 8 truly relevant competitors, both brick-and-mortar stores and online retailers.
Protect your price image and identify opportunities to increase margins.
Scope, data collection, consolidation, followed by analysis and decision-making.
Why Analyze the Competition Beyond Prices
Because price differences can only be understood in the context of each competitor's promotions, product selection, and positioning.
- Protect your price image: maintaining your prices on key products helps prevent a loss of traffic (see how to measure your price image).
- Identify opportunities to increase margins: where your prices are lower for no good reason, you can raise them without risk.
- Anticipating market disruptions: new entrants, structural declines, and changes in product lines.
To move from strategy to action, our pricing analysis assesses your actual competitive positioning, aisle by aisle, and identifies your top margin drivers.
Analyze the competition's catalog, not just their prices
Comparing catalogues reveals what prices alone conceal.
- Breadth and depth of range : how many references per category and what price levels are covered.
- Entry-level prices and private label : the starting price at which the competitor opens each aisle.
- Common or exclusive references : only common references are compared directly; for others, equivalent products are brought together through product matching .
- Rotation : new listings and delistings, which signal a repositioning.
Real-world example: a +1.8-point margin increase without a loss in revenue
An appliance retailer discovers that 18% of its products are overpriced and 22% are priced too low to generate a profit.
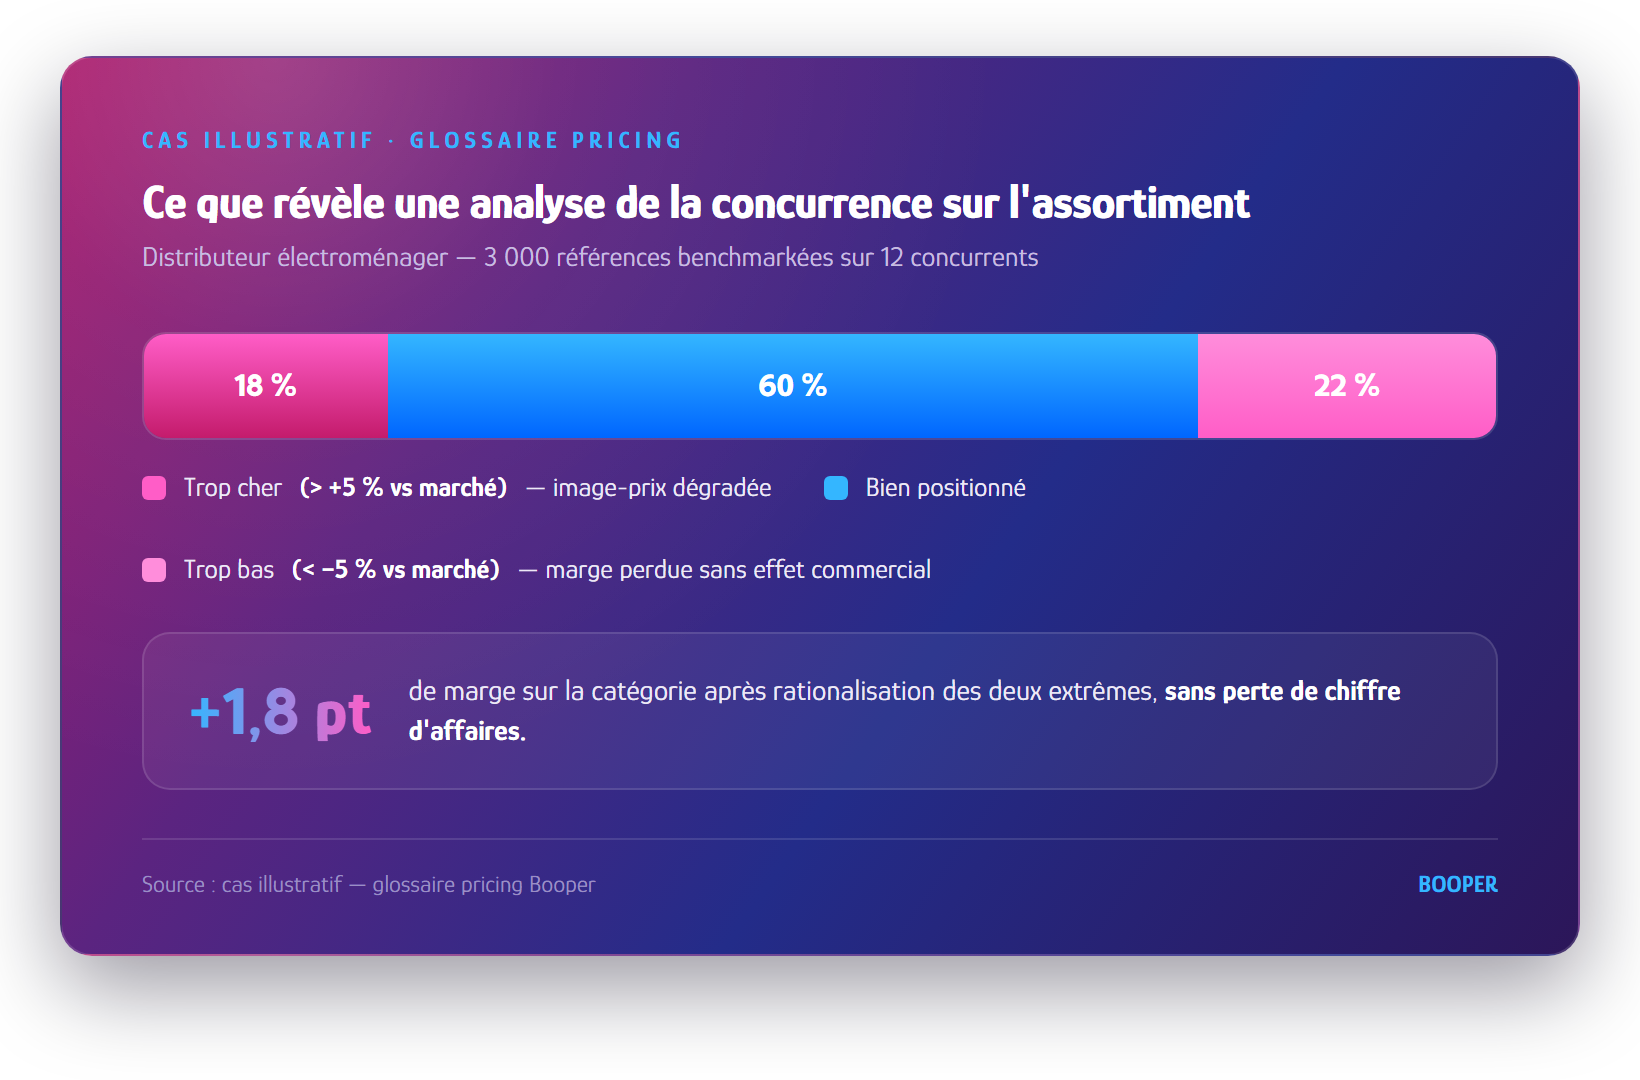
The weekly analysis covers 12 competitors and 3,000 product SKUs. For 18% of the products, prices exceed the market low by more than 5%, damaging the price image; for 22%, prices are more than 5% below the market low without generating additional sales. Streamlining these two extremes yields a 1.8-point margin gain for the category.
How to Analyze the Competition, Step by Step
Four steps, streamlined into a recurring workflow.
Define the scope
Relevant competitors, benchmarks to follow, frequency.
Collect data
Scraping, in-store data collection, partners.
Strengthen and cleanse
Product matching, promotion processing.
Analyze and adjudicate
Positioning by category, product code, and competitor.
Our price tracking and web scraping tools automate the collection and consolidation of competitors’ prices, product assortments, and promotions. Presented in a recurring dashboard, this data serves as a competitive benchmark. For a price-to-price comparison only, see the price comparison.
3 Mistakes to Avoid in Competitive Analysis
Products that aren't on par, too many competitors, or data that never gets turned into decisions.
- Comparing non-equivalent products: incorrect matching distorts all conclusions.
- Following too many competitors: It’s better to have 5 to 8 genuine competitors than 30 retailers.
- Confusing data collection with analysis: simply collecting prices isn't enough; you have to put them in context and use them to make decisions.
Frequently Asked Questions
Short answers to the most frequently asked questions about competitive analysis.
What is competitive pricing analysis?
Competitive pricing analysis is the regular study of competitors' prices, promotions, and product ranges to decide where to match their prices, where to differentiate themselves, and where to maintain their profit margin. It combines data collection, through web scraping of e-commerce sites and in-store surveys, with analysis: comparison by category, price index, and price differences on key products. When conducted effectively, it's not about copying the market but about making informed decisions. A retailer can thus remain aligned with their key performance indicators (KVIs) and raise prices on core products, where customers rarely compare prices.
How to analyze competitor pricing?
To analyze competitor pricing, we proceed in four steps. First, identify the competitors who are actually competing with each store or channel, not all those in the market. Next, choose the key performance indicators (KPIs) to track, starting with the KVIs that customers compare. Then, collect prices regularly using reliable product matching ; otherwise, you'll be comparing different products. Finally, compare by category using a price index and decide, category by category, where to match prices and where to maintain margins.
Why is analyzing competitors' prices no longer enough?
Analyzing competitors' prices is no longer enough because a single price doesn't explain why a customer chooses a particular retailer. Current promotions, product range depth, stockouts, the market share of private label brands, and services like delivery or in-store pickup must also be considered. A competitor that's 3% more expensive can still gain market share if they offer a wider selection or better availability. This is why modern analysis combines price and catalog information: it also compares entry-level prices, exclusive items, and product turnover.
How often should you conduct a competitive analysis?
The frequency of competitive analysis depends on how quickly prices move in your market. In e-commerce, where prices change several times a day, daily data collection is the norm. In large retail stores, weekly monitoring of sensitive products is generally sufficient, supplemented by monthly monitoring of the rest of the catalog. In sectors with low volatility, such as DIY or equipment, a monthly schedule may be appropriate outside of peak periods. The key is to align the data collection frequency with how often you can actually decide on and adjust your prices.
Which competitors should we include?
The competitors you should include are those who truly influence your sales, not just those selling the same products. In practice, this means direct competitors of the same format, pure players and marketplaces that capture a share of online demand, and, for a network of stores, the businesses present in each catchment area. A list that's too broad generates noise and unnecessary alerts; a list that's too short misses a potential competitor. It should be reviewed at least once a year, or as soon as a new player enters your market.
How Can You Automate Competitive Analysis?
To automate competitive analysis, three components are combined: automatic price collection (web scraping, feeds, or digitized field data), product matching that links each product to its competitor equivalent, and dashboards that calculate indices and highlight discrepancies. Automation frees up teams from data collection so they can focus on decision-making. It doesn't replace judgment: business rules, validated by the pricing team, transform a detected discrepancy into a decision to align, maintain, or ignore it.
Key Takeaways
- The competitive analysis covers pricing, promotions, product assortment, and positioning.
- It tracks 5 to 8 relevant competitors, with reliable matching.
- Its value lies in the decisions it drives: pricing strategy and margin opportunities.
Would you like to analyze your competitors on an ongoing basis?
Booper collects and organizes your competitors' prices, product assortments, and promotions for you.
Let's talk about your competitive analysis →Discover our price monitoring softwareYou might also be interested in these articles

Price perception is a subjective perception driven by flagship products (KVI), not by an overall statistical average. For the reader, mastering this lever makes it possible to build customer loyalty without sacrificing overall profitability. A key point? Only 2% of products account for 80% of a retailer’s price perception.
The goal of BOOPER’s Price Assessment is to objectively evaluate this perception rather than speculate about it: to thoroughly analyze your positioning relative to the competition, product by product.

Effective pricing management requires the rigorous integration of internal/endogenous data (costs, historical data) and external/exogenous data (competition, demand). This essential hybridization secures margins and objectifies trade-offs against market fluctuations. By structuring these signals, the organization transforms raw data into an operational profitability lever, deployable in practice in less than sixty days.

A price-monitoring pipeline that continuously tracks competitors’ prices does not protect your price image if it is followed by a simple reflex: automatically aligning the entire catalog with the lowest price detected. This destroys both your margin and your price image, because customers actually compare only a small portion of the products—the showcase items (KVI).
Retailers that carefully curate their window displays rather than stocking their entire catalog gain an additional 1 to 2 percentage points in margin—without any loss in volume—and up to 2 percentage points at an Eastern European chain studied by McKinsey.